Section 5.5 NEW SECTION
Asset Valuation
Asset value is an important piece of financial reporting and TAM. It can be used in financial statement balance sheets, it communicates what an agency owns and maintains, and it supports investment decisions. Financial reporting standards and requirements dictate how to perform the calculations; however, in practice, there is no single correct way to measure an asset’s value.
Note: This section was derived from the web version of NCHRP Web-Only Document 335: A Guide to Computation and Use of System Level Valuation of Transportation Assets. More detailed information is available in this NCHRP Report. A summary is provided below to provide an overview and context.
5.5.1
Asset Valuation Framework
This subsection discusses the significance of asset valuation in transportation asset management (TAM) and its applications, emphasizing its role in communication, fiscal responsibility, testing investment strategies, and prioritizing investments. It explores three perspectives of asset value: cost, market, and economic perspectives, highlighting their differences and applications in assessing the worth of transportation assets.
Note: This subsection was derived from the web version of A Guide to Computation and Use of System Level Valuation of Transportation Assets. More detailed information is available in this NCHRP Report. A summary is provided below to provide an overview and context.
Asset Valuation and Asset Management
Knowing what a physical asset is worth – its value – can be very useful both for financial reporting and for supporting asset management. Even if the notion of asset value is somewhat abstract, an asset owner generally prefers that the value of their assets increases or at least remains constant over time. Fundamentally, tracking and reporting asset value helps a transportation agency monitor the state of its assets and provides a sense of whether the inventory is improving or in a state of decline. Transportation agencies use data on asset value in a variety of ways to support asset management. There are four major applications of asset value aiding an overall asset management program as described below.
- Communicating the Asset Inventory–Asset value is used to communicate what assets an agency owns, their extent, and the agency’s responsibility for maintaining the asset inventory. Each asset has its own unit of measure: pavements may be summarized in terms of lane miles, bridges in terms of deck area, and other assets in terms of a count. However, it can be hard to relate these different units and to summarize the asset portfolio as a whole.
- Demonstrating Fiscal Responsibility–Various measures have been formulated that use asset value and changes in value to demonstrate that an agency is managing its assets responsibly. The basic premise is that as assets deteriorate or depreciate, an agency should invest to maintain their value. Public agencies in Australia and New Zealand have used asset value in this manner for over a decade. In the U.S., several agencies have calculated similar measures such as the Washington State Department of Transportation (WSDOT) Gray Book, which includes several long-term measures for pavement assets related to asset value.
- Testing Investment Strategies–Asset value can be used to help illustrate the difference between alternative investment strategies, such as when comparing a strategy of performing recommended preservation treatments on an asset over its life to an alternative strategy in which preservation treatments are deferred, resulting in worse relative condition and potentially a shorter asset life.
- Prioritizing Investments–Another potential application of asset value for supporting TAM is helping compare and understand asset investment options. While asset value alone is insufficient for prioritizing investments, when used in conjunction with life cycle cost analyses it can provide a complete view of the asset’s worth. In particular, asset value can help prioritize decisions such as: Resilience investments; Reconstruction; or Decommissioning. Asset value provides insights for assets identified for decommission or reconstruction by pitting their intrinsic value (including the replacement cost and socio-economic importance) against the costs necessary to maintain or replace the asset.
Washington State DOT
Washington State DOT (WSDOT) uses asset value-related performance measures for pavement assets to support responsible management of those assets as they deteriorate or depreciate. The WSDOT Gray Notebook, a quarterly performance report of the agency’s assets, includes several long-term measures for pavement assets, including Asset Sustainability Ratio (ASR), Remaining Service Life (RSL), and Deferred Preservation Liability (backlog).


ASR measures the agency’s investments in pavement against the lost value due to depreciation. RSL is a measure of remaining useful life before rehabilitation or replacement is needed due to deterioration. Backlog is the cost incurred due to delayed rehabilitation work. The agency sets targets and monitors trends for these measures, using them to communicate fiscal responsibility and allowing for improved asset management decision-making. In the 2021 Gray Notebook, for example, the RSL target is met, but the ASR fell short of the target, indicating that pavement investment was outpaced by deterioration in that year.
Source: Gray Notebook: Pavement Conditions & Performance. 2021. Washington State DOT. https://wsdot.wa.gov/about/data/gray-notebook/gnbhome/preservation/pavement/conditionperformance.htm
Defining Asset Value
The Organization for Economic Co-Operation and Development (OECD), states that a physical asset has no intrinsic value. Instead, its value results from the benefits it yields, be they to the asset owner, a set of transportation system users, society as a whole, or some combination thereof. As an asset ages, it depreciates, or loses value as its benefits are consumed. The OECD defines three different perspectives to consider asset value: Cost Perspective, Market Perspective, and Economic Perspective. The following provides a brief synopsis of these three perspectives.
- Cost Perspective–The cost perspective focuses on capital costs incurred by the asset owner. When establishing value from this perspective the question is “How much does it cost us to acquire this asset and operate it over time?” The basic issue with the cost perspective is that it leaves no daylight between cost and value; these are one and the same. If one asks what value will be derived from spending $1 million to reconstruct a road, from the cost perspective the answer is “$1 million, of course.” Consequently, the cost perspective can help answer questions about how best to manage assets, but it is ill-suited for addressing questions concerning the underlying value of transportation assets to society. To answer that question requires an economic perspective.
- Market Perspective–The market perspective focuses on the price of an asset on the open market. When establishing value from this perspective the question becomes "How much would this asset sell for on the open market?” For example, the value an automobile might be the resale value should the car be sold through an auction or to a reseller. The virtue of this perspective is that it leverages the behavior of free markets to determine how much value an asset is expected to yield in the future. If the market for an asset is competitive, then the asset’s market value should theoretically account for the future benefits provided to the buyer. The competitive nature of the market should ensure that no asset is sold at less than this value. This perspective is extremely valuable where a well-defined market exists for an asset. The market value of an asset is viewed as the best representation of asset value based on international accounting guidance.
- Economic Perspective–The economic perspective focuses on the benefits generated by an asset. When establishing value from this perspective the question is “What are the benefits of the asset to travelers and society?” In general guidance for asset value, this perspective is also called the “income perspective,” as it involves calculating the income generated by not just an asset, but by its existence. An economic measure of asset value stems from a more comprehensive value, based on the use of a facility. Economic asset valuation is an analytical exercise that establishes a rationale on whether and when a facility ought to be constructed or improved.
The cost, market, and economic perspectives on asset value differ in subtle and important ways. For example, a cost perspective generally starts from an implicit assumption that a facility is worth maintaining at the level of service for which it was originally planned and constructed. The actual use of the facility does not factor into the assessment except when it is used to indirectly estimate the rate of deterioration and maintenance schedule. In comparison, the market approach directly considers the value of the facility to users in addition to the cost to maintain it. The market approach can be considered from the perspective of a concessionaire who could evaluate the facility based on the opportunity to recover the costs to date and earn a profit, perhaps through revenue collection or the value of the land.
Each asset value perspective emphasizes a specific aspect of how transportation assets are constructed and utilized. All three perspectives are valid and can provide insights that help communicate information about assets and support decision-making. While each of the perspectives supports some of the applications described in Section 5.5.1, many public agencies rely on the cost perspective for their calculation of asset value. The cost perspective helps an agency directly relate its expenditures on assets to changes in their value, and it supports a large number of TAM-related applications. Also, where a market exists, the cost of replacing the asset, depreciated based on its age or use, tends to correlate closely to its price. Where no market exists, the depreciated replacement cost serves as a proxy for its market price.
5.5.2
Using Asset Value to Support TAM Decisions
Once calculated, asset value and related measures can support a range of applications in transportation asset management. These applications are summarized through a set of six key questions which asset value and related measures may help answer.
Note: This subsection was derived from the web version of A Guide to Computation and Use of System Level Valuation of Transportation Assets. More detailed information is available in this NCHRP Report. A summary is provided below to provide an overview and context.
6 Key Summarizing Questions
- What is the overall value of the asset inventory? This is the most fundamental question about asset value. What exactly is the value of a given inventory of assets?
- What is the cost to maintain current asset value? Establishing overall asset value for each asset classification is a prelude to this follow up question. An agency would need to determine how much value is lost each year as assets age, and what investments are needed to offset depreciation and optimize the assets’ lifespans.
- How much should an agency invest in existing assets? This question is closely related to the second question, but the two questions may have different answers. If the measure of value is meaningful, then an agency should ideally spend enough money to maintain or increase asset value over time. However, it is inevitable that the value of a given asset will decline following construction or renewal of the asset: it is simply not realistic to expect assets to remain in a “like new” condition indefinitely. On the other hand, if the value of the asset inventory has declined to the point that is demonstrably suboptimal (e.g., a case in which assets are in such poor condition that users experience increased costs from delay and the agency incurs increased costs from emergency maintenance) then merely maintaining existing condition is undesirable. Answering this question requires additional analysis to determine the asset value associated with achieving an agency’s “desired state of good repair,” and the cost to achieve this value. Once obtained, the answer supports decisions about how much to invest in the asset inventory.
- How should funds be allocated between different assets or networks? To the extent that funds are insufficient for addressing all of an agency’s investment needs, it may be necessary to prioritize between different asset classes or networks (e.g., the Interstate System, Non-Interstate NHS, and Non-NHS). Information on asset value helps communicate the size of the inventory expressed in a single unit of measure – dollars.
- What’s the best life cycle strategy for our assets? Information on asset value, together with supporting management systems, can be used to test different asset life cycle strategies and illustrate the effectiveness of different strategies for maximizing value. Doing this requires predicting asset value assuming different strategies and comparing their results.
- What is the value generated by the asset? Much of the discussion thus far has revolved around the value of the asset, as it relates to construction and maintenance costs. However, two assets of the same type, length, and roadway characteristics may generate strikingly different value for the communities that use them. Variations in the volume of traffic, the availability of alternative routes, and the accessibility offered by these roads are only some of the factors affecting how road users perceive their value. When considering investment decisions, it is important to account for the road user’s perspective.
Department of Transport and Planning
The City of Melbourne, the capital of the Australian state of Victoria, uses asset value to drive asset management in two ways:
First, the city communicates the asset inventory in part through asset value. The City Asset Plan includes both the fair, written-down value (current depreciated value) and a replacement value for each of the assets owned by the agency, including numerous infrastructure assets such as roads, bridges, footpaths, drainage, and other assets. The city uses these two numbers to communicate the extent and condition of their assets to the public and other stakeholders.
Second, the city uses two performance measures related to asset value to demonstrate fiscal responsibility: the ratio of renewal and upgrade expenditures to depreciation, and the ratio of total capital replacement expenditures to depreciation. These measures are variations of an asset sustainability ratio, which summarizes whether an agency is investing sufficiently to maintain asset value and conditions. The city of Melbourne set performance targets of 0.5 for the renewal and upgrade ratio and 1.0 for the capital replacement ratio. Meeting those targets means that the city is investing at a level sufficient to maintain or improve asset value. The table below demonstrates these measures. It shows the actual values from 2016 through 2019, and forecasts values for 2020-2021.
| CAPITAL WORKS PERCENTAGE OF DEPRECIATION | 2016-17 ACTUAL ($'000) | 2017-18 ACTUAL ($'000) | 2018-19 ACTUAL ($'000) | 2019-20 ACTUAL ($'000) | 2020-21 Forecast ($'000) |
|---|---|---|---|---|---|
| Renewal & Upgrade Works | 53,190 | 58,698 | 55,722 | 71,836 | 108,668 |
| Depreciation | 57,717 | 58,507 | 57,889 | 61,048 | 64,658 |
| Renewal & Upgrade / Depreciation Totals | 79% | 86% | 82% | 85% | 168% |
| Five-Year Average | 116% | ||||
| All Capital Works / Depreciation Totals | 136% | 180% | 211% | 202% | 288% |
| Five-Year Average: | 205% |
In addition to calculating asset sustainability ratios based on actual historical data, the city estimates the performance measures for 10 years into the future, predicting depreciation and capital expenditures. This allows the city to better align planned expenditures and needs.
Source: City of Melbourne. City of Melbourne Asset Plan 2021-31. City of Melbourne, 2021. Web access: http://www.melbourne.vic.gov.au/about-council/governance-transparency/policies-protocols/Pages/asset-plan-2021-31.aspx
Carver County Public Works
Carver County, located in the Minneapolis-St. Paul metropolitan area, is responsible for managing a variety of transportation assets, including rural and urban roads, intersections, lighting, railroad crossings, and pedestrian crossings. Carver County Public Works captured these assets in a 2021 Transportation Asset Management Plan which uses asset value to communicate the scope and condition of the system.
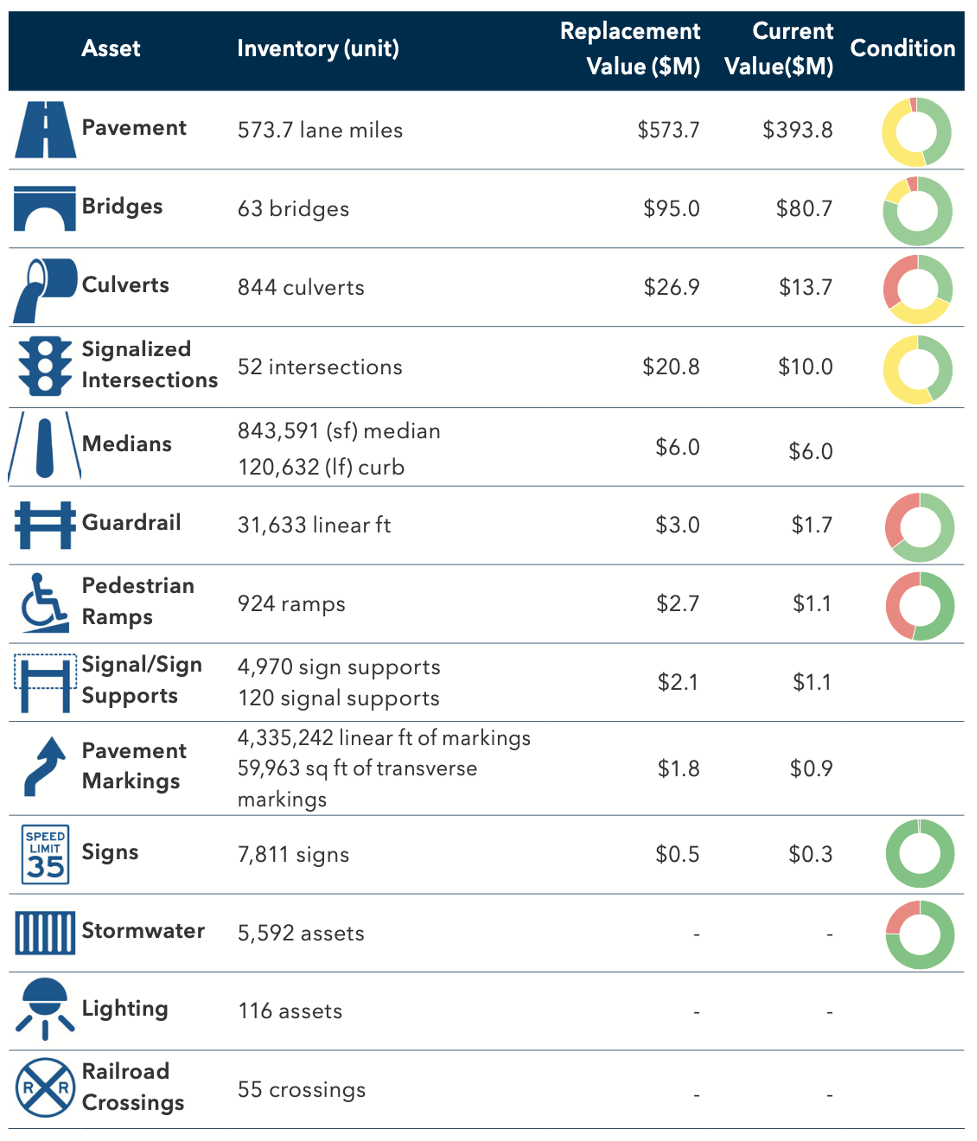
For each asset, Carver County calculates a replacement value (unit costs * units) and a current value (replacement value – depreciation) using the cost perspective. Due to varying levels of resources and data available for each asset, there are multiple ways that depreciation is calculated, including age-based and condition-based approaches. Some assets use compliance with standards and guidelines (e.g. ADA) as a proxy for condition, which in turn is used to calculate depreciation.
The asset replacement and current values help communicate the state of the county’s asset inventory to the public and provide a financial account of the publicly owned assets.
Source: Carver County Public Works Division. Transportation Asset Management Plan: Carver County. Carver County Public Works Division, 2021.
Washington State DOT
Washington State DOT (WSDOT) uses asset value-related performance measures for pavement assets to support responsible management of those assets as they deteriorate or depreciate. The WSDOT Gray Notebook, a quarterly performance report of the agency’s assets, includes several long-term measures for pavement assets, including Asset Sustainability Ratio (ASR), Remaining Service Life (RSL), and Deferred Preservation Liability (backlog).
ASR measures the agency’s investments in pavement against the lost value due to depreciation. RSL is a measure of remaining useful life before rehabilitation or replacement is needed due to deterioration. Backlog is the cost incurred due to delayed rehabilitation work. The agency sets targets and monitors trends for these measures, using them to communicate fiscal responsibility and allowing for improved asset management decision-making. In the 2021 Gray Notebook, for example, the RSL target is met, but the ASR fell short of the target, indicating that pavement investment was outpaced by deterioration in that year.
Source: Gray Notebook: Pavement Conditions & Performance. 2021. Washington State DOT. https://wsdot.wa.gov/about/data/gray-notebook/gnbhome/preservation/pavement/conditionperformance.htm
Department of Transport and Planning
The City of Melbourne, the capital of the Australian state of Victoria, uses asset value to drive asset management in two ways:
First, the city communicates the asset inventory in part through asset value. The City Asset Plan includes both the fair, written-down value (current depreciated value) and a replacement value for each of the assets owned by the agency, including numerous infrastructure assets such as roads, bridges, footpaths, drainage, and other assets. The city uses these two numbers to communicate the extent and condition of their assets to the public and other stakeholders.
Second, the city uses two performance measures related to asset value to demonstrate fiscal responsibility: the ratio of renewal and upgrade expenditures to depreciation, and the ratio of total capital replacement expenditures to depreciation. These measures are variations of an asset sustainability ratio, which summarizes whether an agency is investing sufficiently to maintain asset value and conditions. The city of Melbourne set performance targets of 0.5 for the renewal and upgrade ratio and 1.0 for the capital replacement ratio. Meeting those targets means that the city is investing at a level sufficient to maintain or improve asset value. The table below demonstrates these measures. It shows the actual values from 2016 through 2019, and forecasts values for 2020-2021.
| CAPITAL WORKS PERCENTAGE OF DEPRECIATION | 2016-17 ACTUAL ($'000) | 2017-18 ACTUAL ($'000) | 2018-19 ACTUAL ($'000) | 2019-20 ACTUAL ($'000) | 2020-21 Forecast ($'000) |
|---|---|---|---|---|---|
| Renewal & Upgrade Works | 53,190 | 58,698 | 55,722 | 71,836 | 108,668 |
| Depreciation | 57,717 | 58,507 | 57,889 | 61,048 | 64,658 |
| Renewal & Upgrade / Depreciation Totals | 79% | 86% | 82% | 85% | 168% |
| Five-Year Average | 116% | ||||
| All Capital Works / Depreciation Totals | 136% | 180% | 211% | 202% | 288% |
| Five-Year Average: | 205% |
In addition to calculating asset sustainability ratios based on actual historical data, the city estimates the performance measures for 10 years into the future, predicting depreciation and capital expenditures. This allows the city to better align planned expenditures and needs.
Source: City of Melbourne. City of Melbourne Asset Plan 2021-31. City of Melbourne, 2021. Web access: http://www.melbourne.vic.gov.au/about-council/governance-transparency/policies-protocols/Pages/asset-plan-2021-31.aspx
Carver County Public Works
Carver County, located in the Minneapolis-St. Paul metropolitan area, is responsible for managing a variety of transportation assets, including rural and urban roads, intersections, lighting, railroad crossings, and pedestrian crossings. Carver County Public Works captured these assets in a 2021 Transportation Asset Management Plan which uses asset value to communicate the scope and condition of the system.
For each asset, Carver County calculates a replacement value (unit costs * units) and a current value (replacement value – depreciation) using the cost perspective. Due to varying levels of resources and data available for each asset, there are multiple ways that depreciation is calculated, including age-based and condition-based approaches. Some assets use compliance with standards and guidelines (e.g. ADA) as a proxy for condition, which in turn is used to calculate depreciation.
The asset replacement and current values help communicate the state of the county’s asset inventory to the public and provide a financial account of the publicly owned assets.
Source: Carver County Public Works Division. Transportation Asset Management Plan: Carver County. Carver County Public Works Division, 2021.