Explore the Guide
Explore the Guide through curated content pages matching specific users or topics. This page collects practice examples, checklists, and how-to guides.
State Practices

Practice Example Links
Risk Register Development
Arkansas DOTAs part of the process of developing its 2018 TAMP, ARDOT developed a risk register and mitigation plan compliant with FHWA TAMP requirements. As part of this effort, ARDOT first reviewed and documented its existing controls for asset-related risks incorporated in its design specifications, and approaches for addressing specific risks to bridges (e.g., scour). The agency then developed an initial register through a risk workshop. In the workshop, ARDOT staff identified specific risks not otherwise addressed programmatically, classifying risks by type:
- Asset Performance
- External Threats
- Business Operations
- Highway Safety
- Finances
- Project and Program Management
- Information and Decision Making
For each risk ARDOT used expert judgment to classify the risk in terms of its likelihood and impact. An initial priority was determined based on this classification. Next, ARDOT defined potential mitigation strategies for each of the 14 high-priority asset management risks in the register. A total of 12 strategies were identified, with each helping to mitigate one or more different risks. ARDOT next prioritized the mitigation strategies, and developed mitigation and monitoring plans detailing actions to be undertaken, and the approach for monitoring the risks and updating the register moving forward.
Arkansas DOT. 2018. ArDOT Risk-Based Transportation Asset Management Plan. http://www.tamptemplate.org/wp-content/uploads/tamps/037_arkansasdot.pdf
Read more in the chapter: 2.2.3 Risk Management
Aligning Investments With Strategic Objectives
Arizona DOTIn 2001, during the development of a long-range transportation plan (LRTP), the Arizona DOT took a strategic approach to how investments should be made. Under the new approach, Arizona DOT established the following three investment categories:
- Preservation, including activities that preserve existing transportation infrastructure.
- Modernization, including improvements that upgrade the efficiency, functionality, and safety without adding capacity.
- Expansion, including improvements that add transportation capacity by adding new facilities or services.
To implement the new initiative, the Arizona DOT developed a report titled “Linking the Long-Range Transportation Plan and Construction Program” or "P2P Link” that applied financial constraints to the long-term vision. Through a collaborative process that involved a consultant, local and regional governments, and transit agencies, the Arizona DOT published an implementation plan for putting the P2P Link into practice. The resulting process includes scoring projects based on both a technical and policy score that are added together to determine a project’s ranking. The technical score is generated by the asset owner based on an analysis of the data while the policy score is determined based on each project’s contribution to LRTP goals and performance measures. The process helps to ensure that projects are ranked in accordance with the agency’s strategic objectives using only the most meaningful criteria in a transparent and defensible way.
Arizona DOT’s Link Between Strategic Objectives and Investment Decisions
Source: ADOT. 2014. Linking the Long-Range Plan and Construction Program P2P Link Methodologies & Implementation Plan.
https://azdot.gov/sites/default/files/2019/08/p2p-methodologies-implementation.pdf
Asset Management Organizational Models - Executive Office
CaltransAt Caltrans, the TAM group is in the executive office because of a desire to elevate the importance of asset management. The TAM group has more than 10 people in it who manage the TAMP development, and are also responsible for resource allocation for the State Highway Operation and Protection Program (SHOPP). The SHOPP is a ~$4B annual program for major projects on the California State Highway System (SHS).
Read more in the chapter: 3.1.1 Organizational ModelsBuilding a TAM Unit in the Executive Office
CaltransIn 2015, the Caltrans Director created a TAM lead in the agency, recognizing the importance of TAM and the necessity of having a TAM lead who is responsible for implementing TAM and meeting federal and state TAM-related requirements. The TAM lead reports directly to the Caltrans Chief Deputy Director. The TAM lead started without any staff, but the unit has grown to house over ten people. The TAM lead is a veteran of the department and is able to advance the TAM program by getting leadership commitment at the executive level and having the business units throughout the department contribute to needed activities.
Read more in the chapter: 3.1.1 Organizational Models
Maintenance Performance Measures
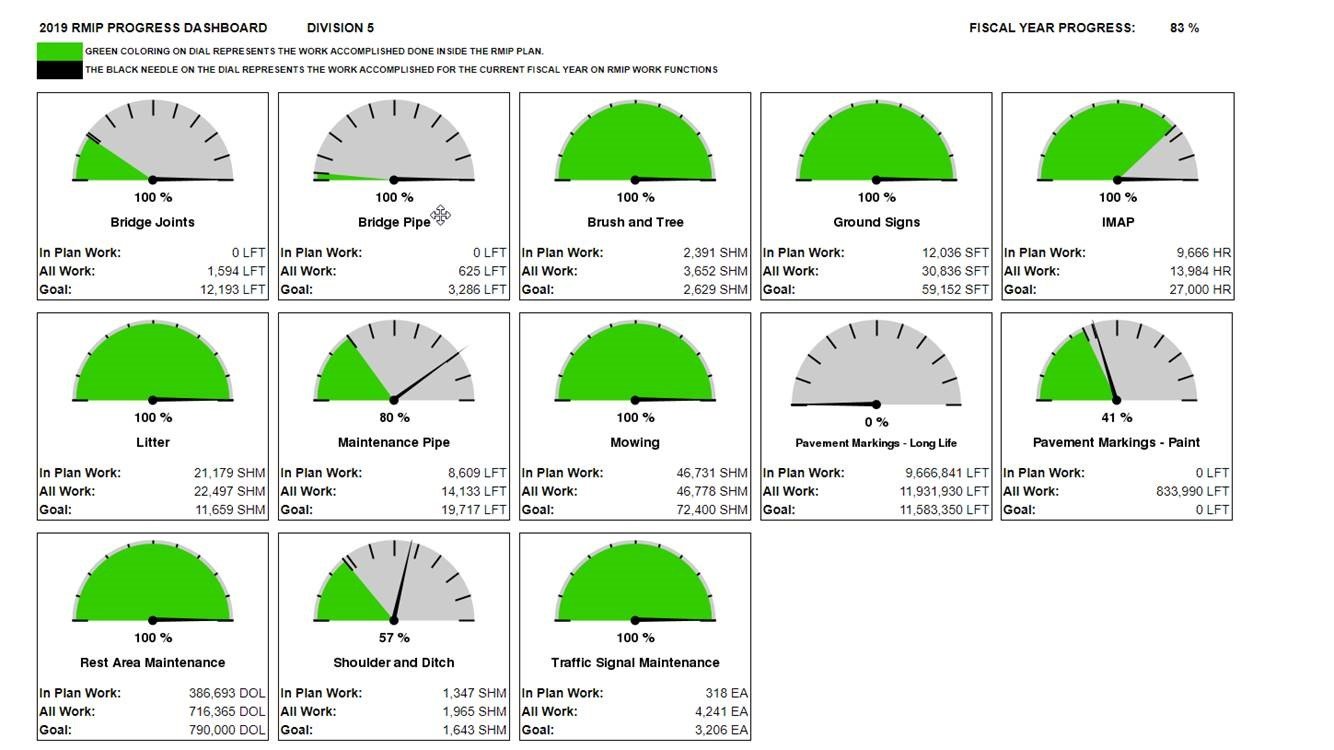
North Carolina DOTThe North Carolina DOT authorizes its divisions to determine how funding will be used for maintenance activities and uses performance data to assist with this activity. Each year, Division Engineers submit annual plans detailing what work will be accomplished; these plans are reviewed quarterly with the Chief Engineer to discuss actual versus planned work. Their accomplishments are also displayed in a dashboard for internal use, as shown in the following image. Public-facing dashboards are also available showing overall conditions and performance trends. The Division Engineers are also held accountable for their performance, since their planned and actual performance data are incorporated into their annual evaluations.
Source: Leading Management Practices in Determining Funding Levels for Maintenance and Preservation. Scan Team Report, NCHRP Project 20-68A, Scan 14-01, National Cooperative Highway Research Program, May 2016.
Read more in the chapter: 6.1.1 Selecting and Using Performance MeasuresProject Delivery Selection
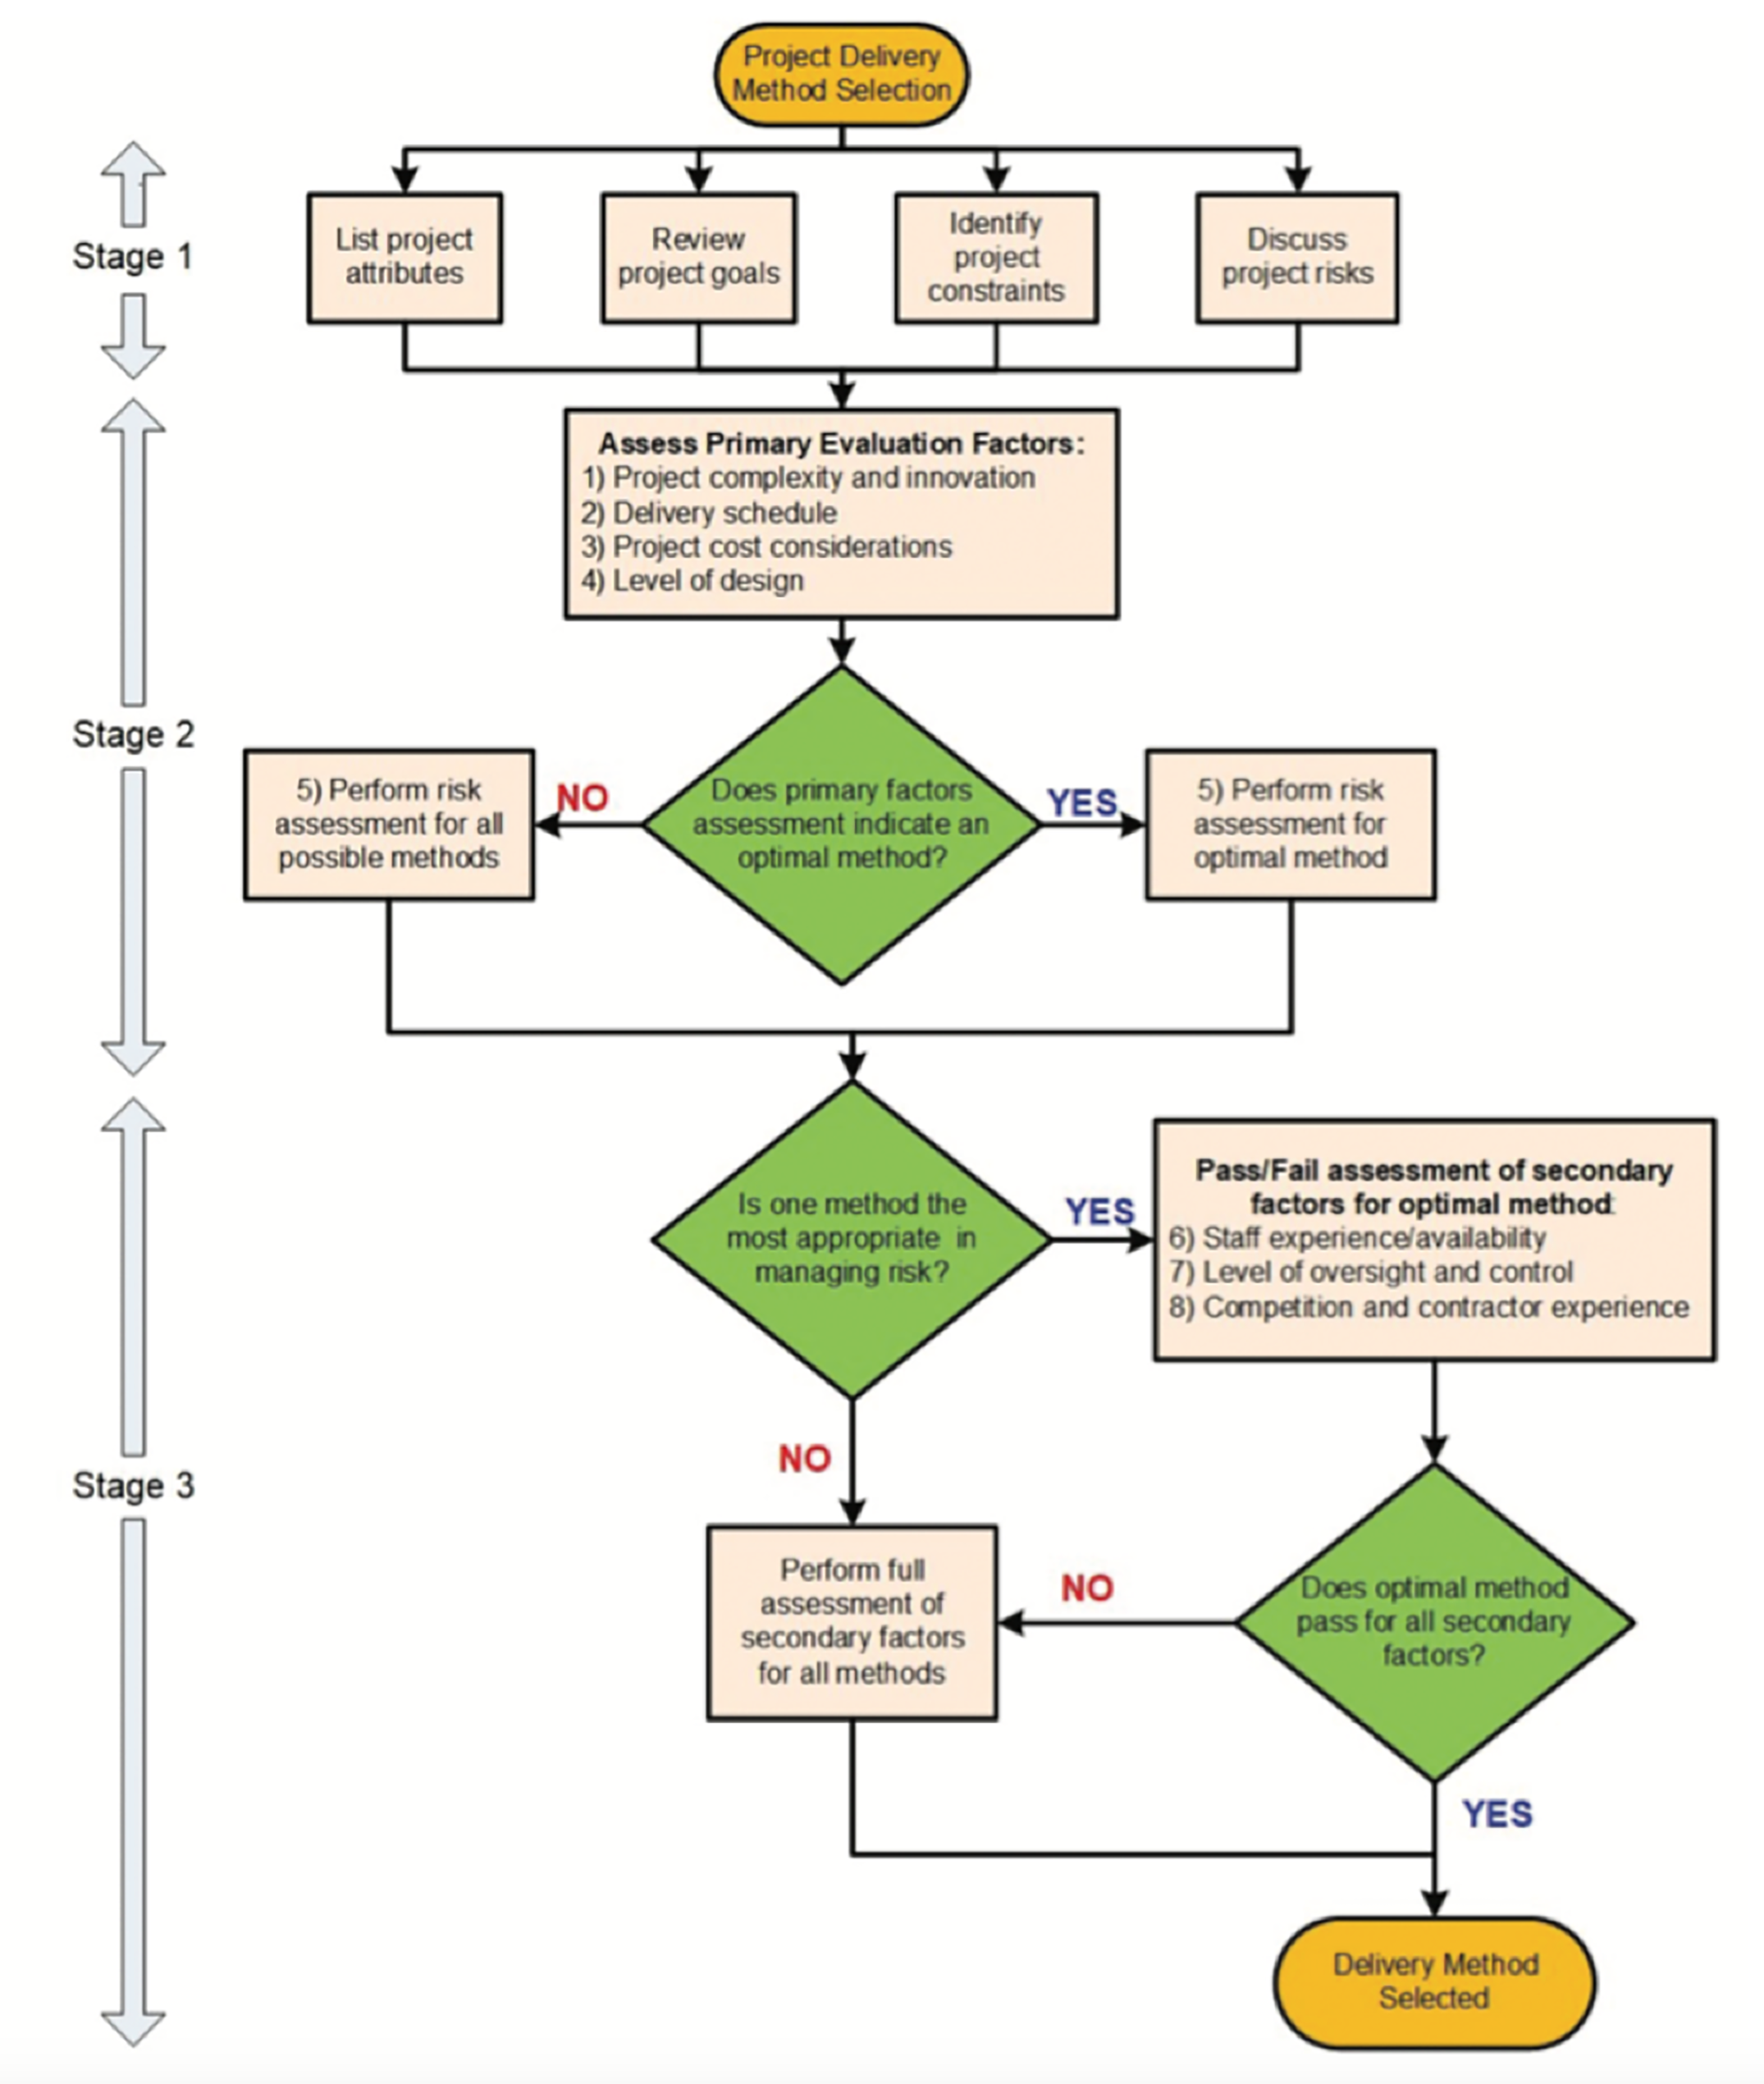
Colorado DOTIn 2011 CDOT’s Innovative Contracting Advisory Committee (ICAC) began work to develop a structured approach for selecting the best delivery mechanism for a given transportation project. Through a set of workshops ICAC identified different factors that the agency should consider in selecting a delivery approach, including five primary factors (project complexity and innovation, delivery schedule, cost considerations, level of design, and risk assessment) and three secondary factors (staff experience and availability, level of oversight and control, and competition and contractor experience). ICAC then defined a three-stage approach for making the delivery decision. In Stage 1 CDOT identifies project goals, constraints and attributes. In Stage 2 CDOT assesses the primary factors, and in Stage 3 assesses the additional secondary factors. The approach is illustrated in the figure. As of 2018 CDOT has used the approach to assess 25 different projects, resulting in the selection of a mix of projects using DBB, DB and GM-GC.
Source: TR News 316 http://onlinepubs.trb.org/onlinepubs/trnews/trnews316.pdf)
Read more in the chapter: 5.4.2 Implications for Resource Allocation
Use of Performance Targets to Support Resource Allocation
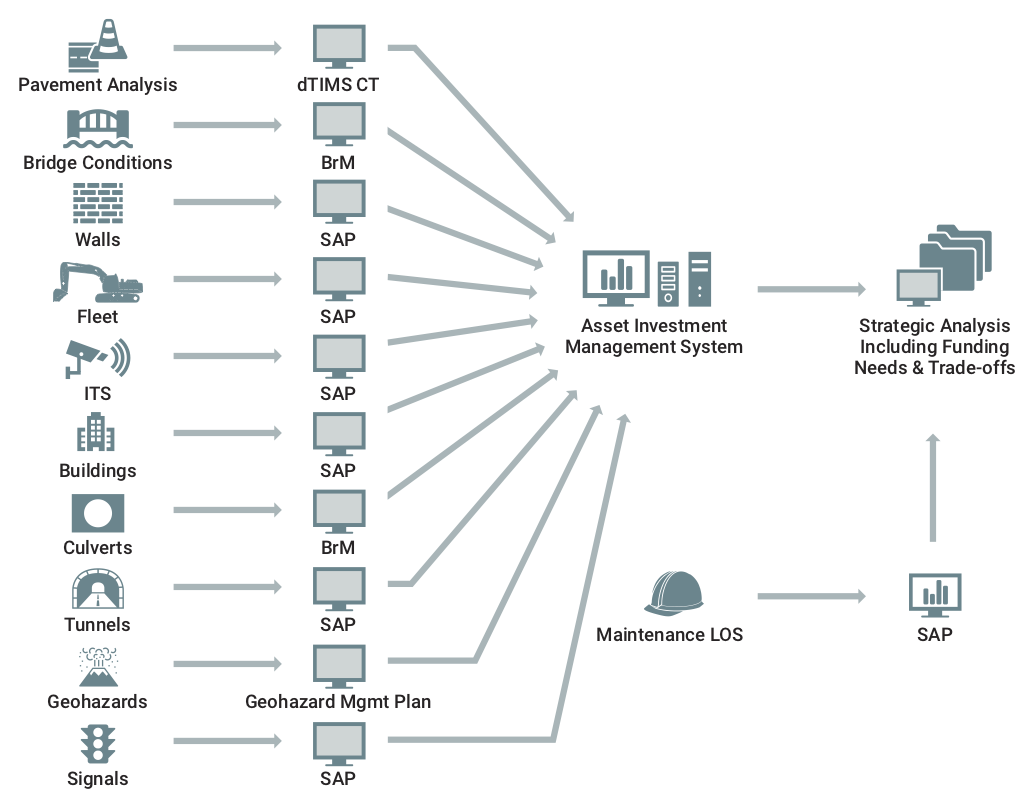
Colorado DOTThe budget-setting process used by CDOT and described in its 2018 TAMP is an example of a resource allocation process emphasizing use of performance targets to support cross-asset resource allocation. CDOT organizes its asset inventory into 11 different asset classes. Different management systems and approaches are used for each asset class to calculate current conditions and predict future performance given a specified budget and other data. The figure illustrates the asset classes and systems used to support analysis of each asset class as of 2018.
The measures used summarize conditions that vary by asset class. For instance, for pavement CDOT predicts percent of pavement with high, moderate, and low drivability life. For bridges, CDOT predicts percent of bridges in good/fair/poor condition based on the FHWA bridge condition measure. For maintenance and buildings CDOT predicts a level of service on a letter grade (A to F) scale.
On an annual basis CDOT performs a separate analysis for each asset class of existing conditions and predicted conditions for different budget scenarios. The manager for each asset class then presents a budget request and business case for the asset class in a workshop setting. Workshop participants, including the asset class managers and representatives from each CDOT region, then vote on the allocation of budget by asset class. The allocation serves as a recommendation to CDOT’s Transportation Commission, which is charged with adopting CDOT’s budget. Separate processes are used in each asset area to prioritize work once the budget is established.
Sources:
TAM Peer Exchange Presentation
CDOT Asset Classes and Analysis Systems
Source: William Johnson, 2018 FHWA TAM Peer Exchange
Read more in the chapter: 5.2.2 Use of Performance Targets to Support Cross-Asset Resource AllocationRisk-Based Rock-Fall Management Program
Colorado DOTColorado DOT responds to between 50 and 70 geotechnical emergencies a year. The traditional approach to managing rockfalls was based on the size and frequency of rockfalls. This approach did not consider the criticality of the facilities that could be impacted by a geohazard event. Since 2013, the Colorado DOT has used a risk-based approach to evaluate and prioritize geohazard mitigation activities based on the size of the geohazard areas and the frequency of falls. Colorado DOT’s approach includes a measure of Risk Exposure (RE), which is based on three components:
- Average Annual Daily Traffic (AADT).
- Likelihood of a Vehicle Being Affected by a Geohazard Event. This metric considers site-distance, the number of previous rock-fall accidents, and a measure of how frequently a vehicle is below the hazard on a daily basis.
- Reduction Factor. This considers the effectiveness of prior mitigation actions, to reduce the RE score.
Colorado DOT’s geohazards program uses the RE to allocate an annual budget of about $10 million to manage geohazards. Due to the inherent uncertainty of geohazard management, in addition to the geohazard management program, maintenance staff regularly patrol highways known to have geohazards. If a hazard requiring immediate action is identified, maintenance crews respond promptly. Using the RE for prioritization allows Colorado DOT to focus its efforts on reducing the impact of geohazards on users of the highway system.
Read more in the chapter: 4.3.2 Applying Other Life Cycle Management ApproachesMaintenance Levels of Service
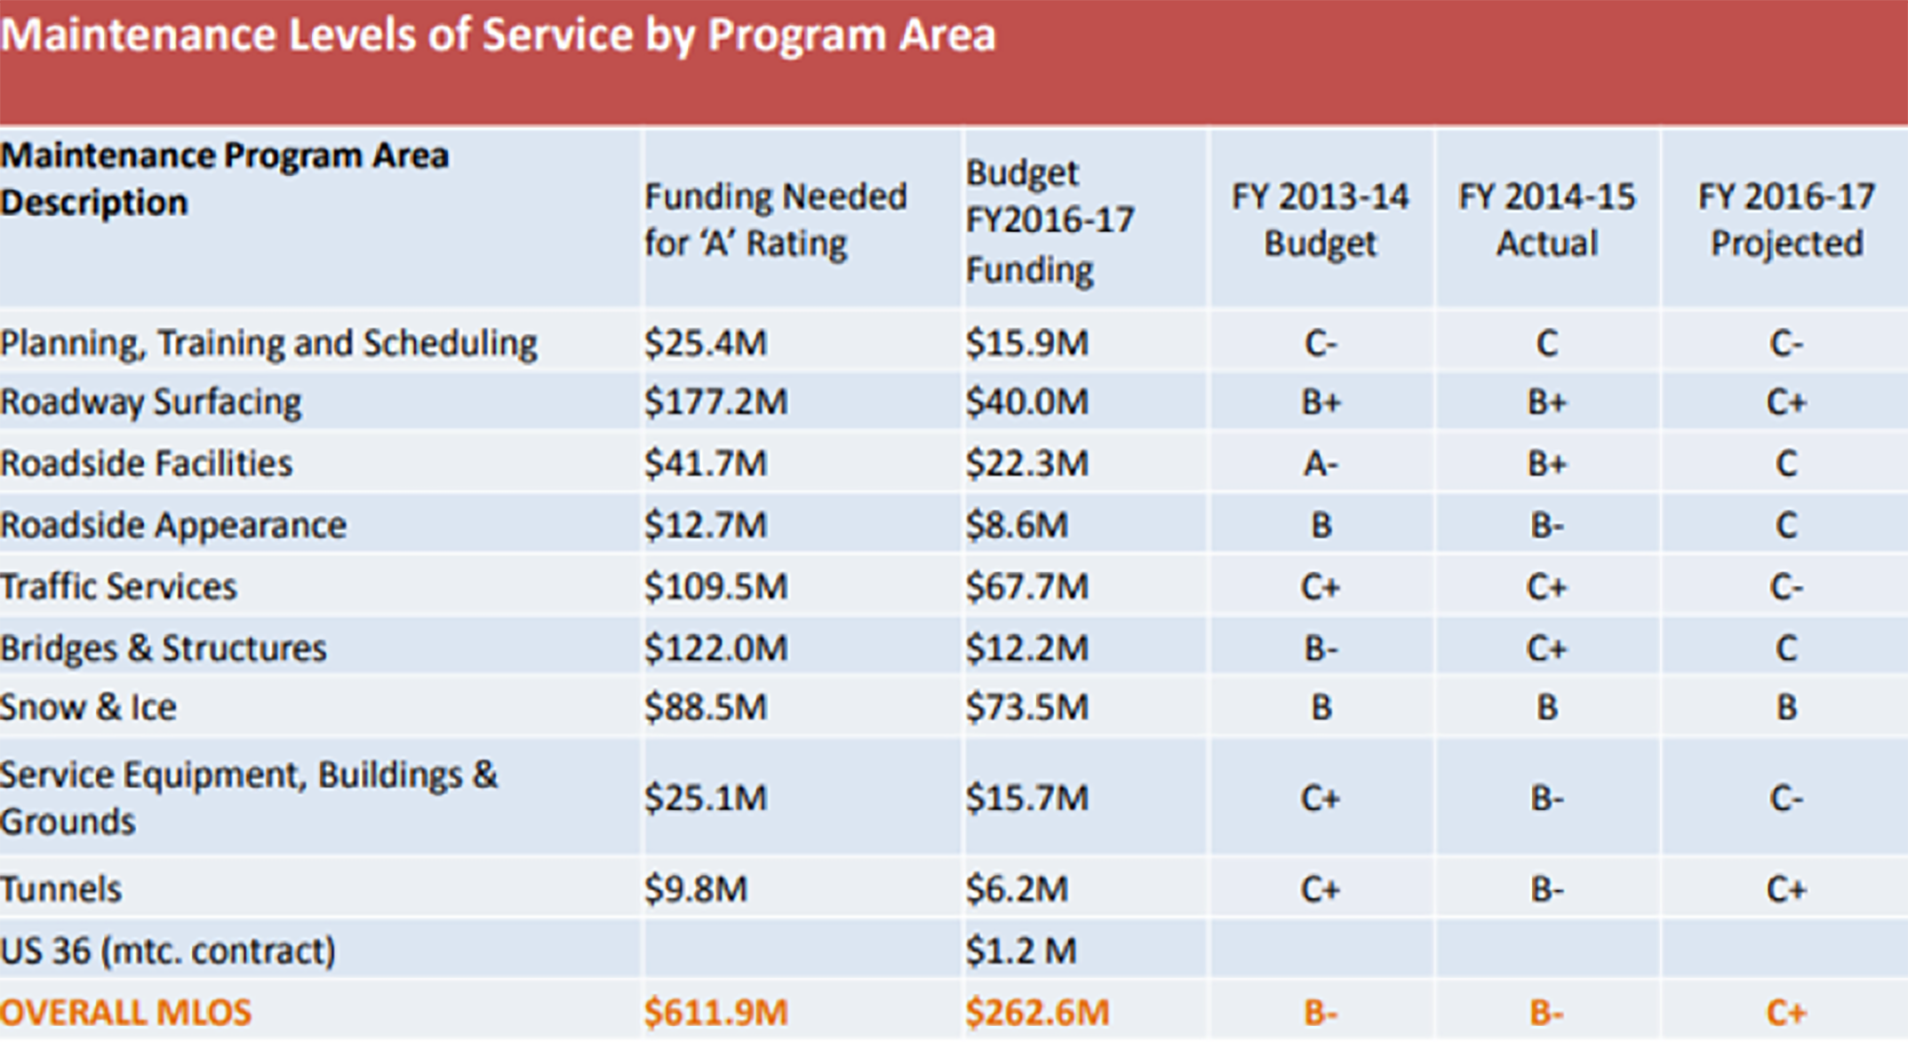
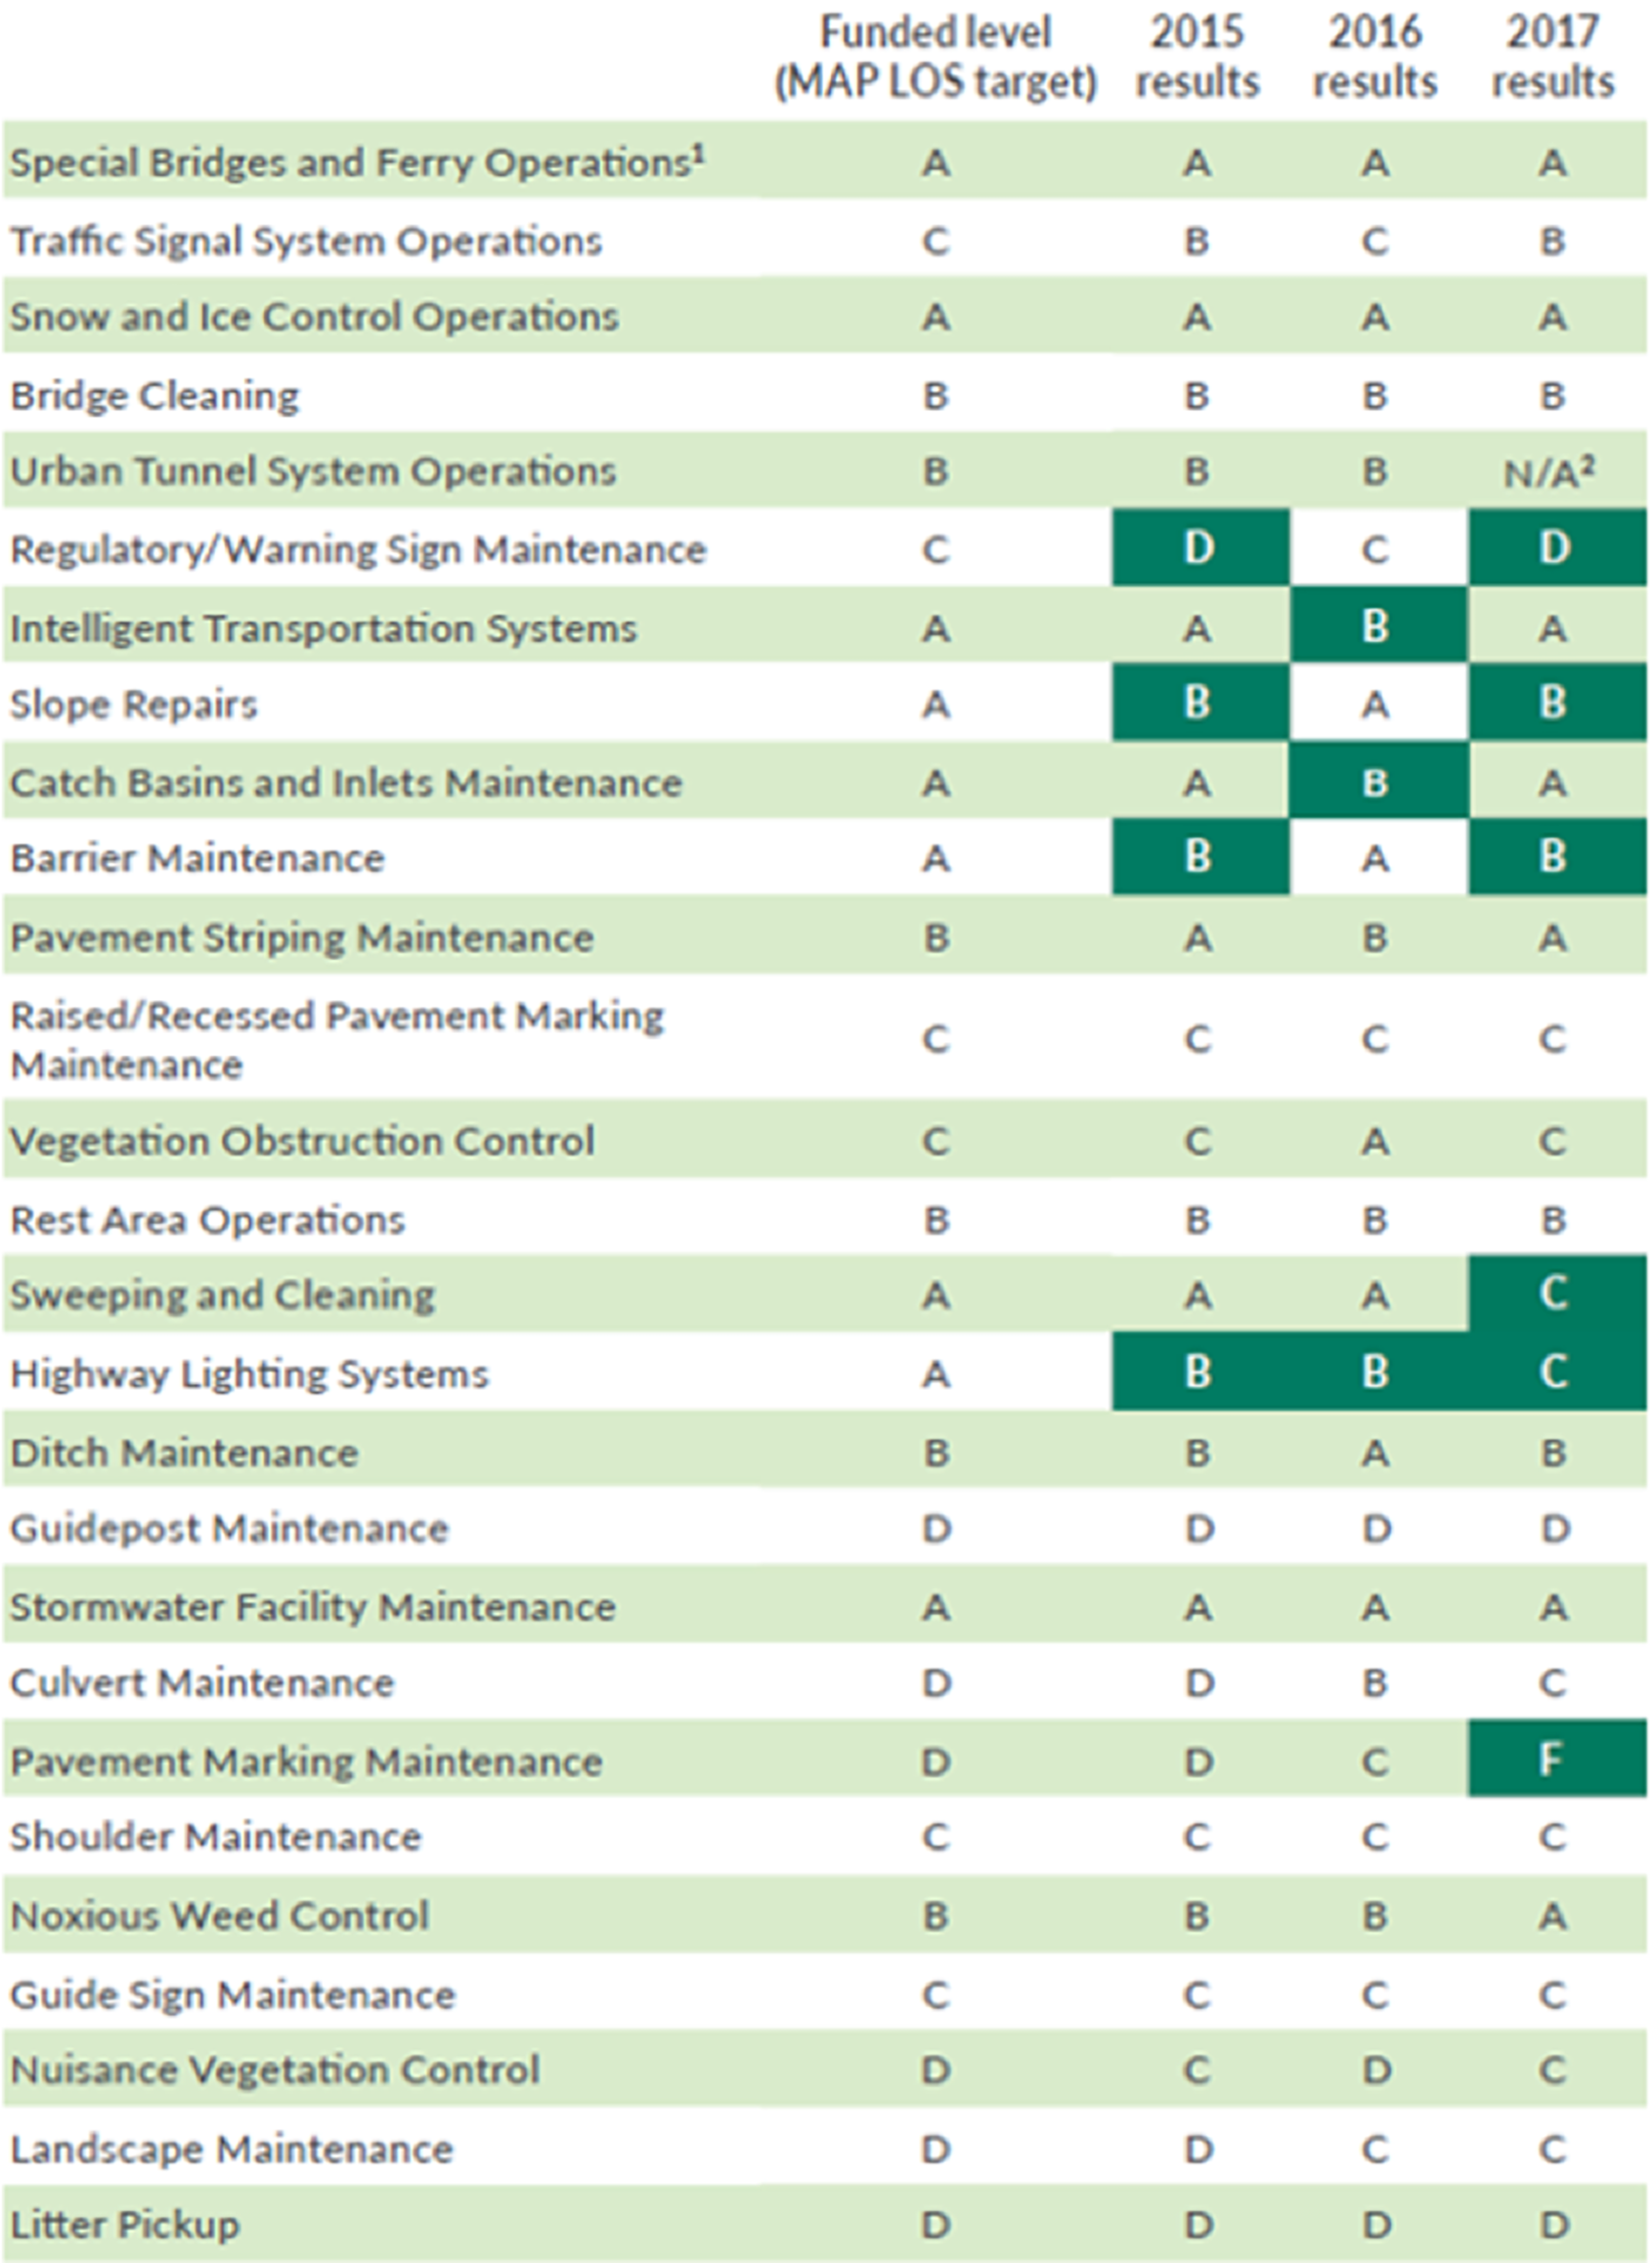
Colorado DOTEach year, the Colorado DOT must report to its legislature on the statewide highway infrastructure and the agency’s ability to meet those needs with available resources. This requirement is met through the Annual Infrastructure Deficit Report, which addresses pavements, bridges, and annual maintenance. The agency supports the annual maintenance portion of this report with its Maintenance Level of Service Measure, which rates the delivery of services in nine program areas in terms of a letter grade from A to D and F. The agency has used historic data to develop deterioration rates for each service area that estimate the resources needed to improve the maintenance level of service by a given amount over a specific time period. These estimates are summarized in the Report, which is in turn used by the Legislature and the DOT to establish the annual maintenance budget. The figure provides an example of information on MLOS in the 2016 Report. Once the targeted MLOS is established, maintenance funding can be allocated to ensure that agency priorities are met.
Colorado DOT Example of Funding Needed to Support Maintenance Levels of Service
Source: Colorado DOT. 2016. https://leg.colorado.gov/sites/default/files/cdot_smart_2017_presentation.1.pdf
Read more in the chapter: 4.1.2 Defining Asset Service and Performance LevelsTAMP Requirements Checklist
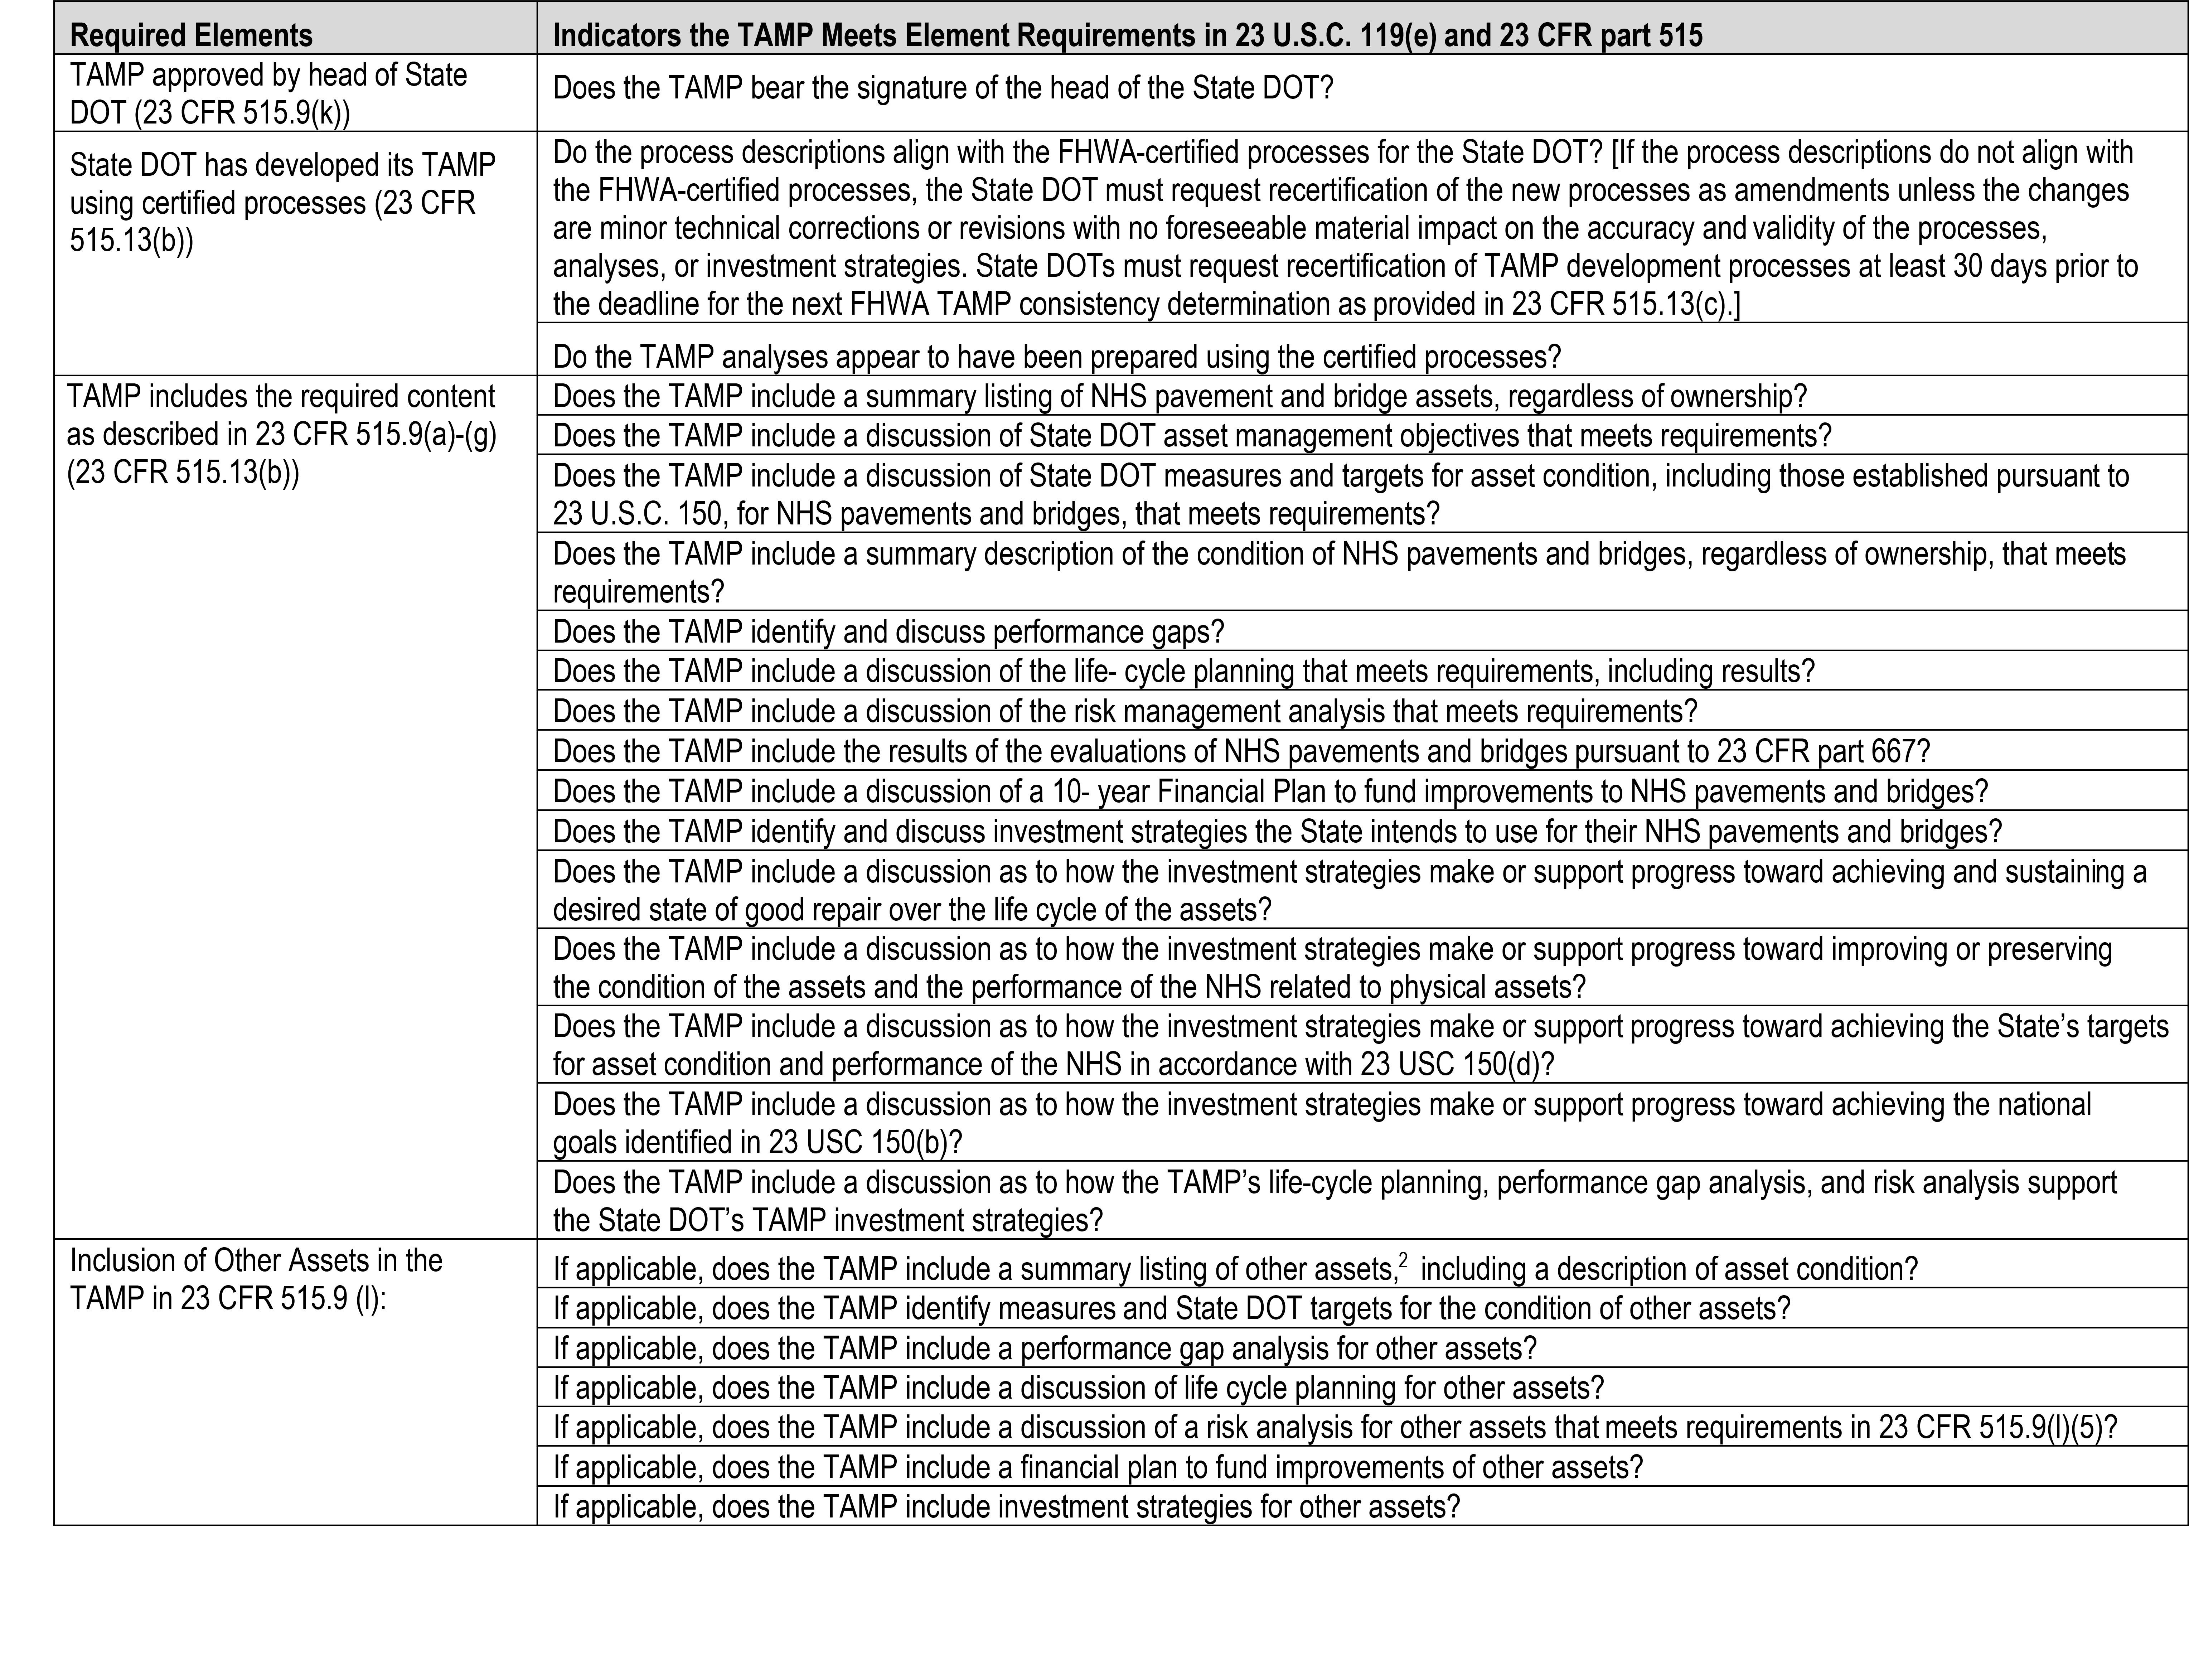
Colorado DOTTo ensure alignment with the requirements of MAP-21, Colorado DOT developed a requirements checklist that provides a quick reference/summary of the legislation requirements. The checklist is based on FHWA guidance (Transportation Asset Management Plan Annual Consistency Determination Final Guidance) that was issued in February, 2018. Its content was provided to help DOTs ensure their TAMPs are compliant and consistent with statute and regulatory requirements.
Source: FHWA. Transportation Asset Management Plan Annual Consistency Determination Final Guidance. https://www.fhwa.dot.gov/asset/guidance/consistency.pdf
Read more in the chapter: 2.4.1 The Basic TAMPCreating an Asset Management Policy
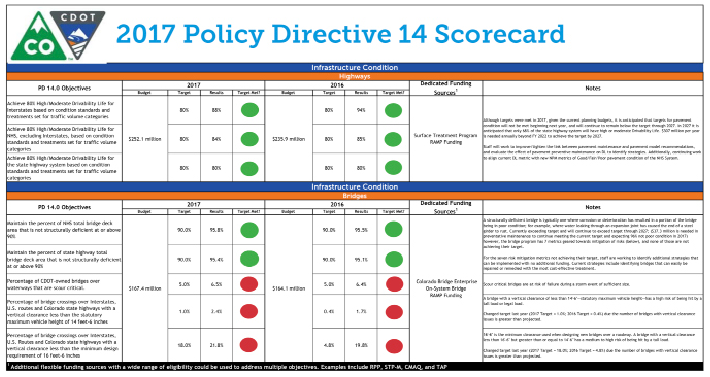
Colorado DOTIn 2015, the Colorado Department of Transportation (CDOT) updated Policy Directive 14 (PD 14.0) “Policy Guiding Statewide Plan Development” to reinforce the importance of TAM in the transportation budget allocation process. It includes the following objectives:
- Infrastructure Condition – Preserve the transportation infrastructure condition to ensure safety and mobility at a least life cycle cost
- Maintenance – Annually maintain CDOT’s roadways and facilities to minimize the need for replacement and rehabilitation
Embedded in this policy are target-setting requirements that the Transportation Commission requested. A performance tracking mechanism is tied to this policy directive. This performance management focus is reinforced annually in a PD14 workshop hosted by the Transportation Commission where the most recent performance results are presented.
Source: Colorado DOT Scorecard, 2017.
Read more in the chapter: 2.1.2 Creating a TAM PolicyChange Management Success Factors
Colorado DOTColorado DOT’s (CDOT) change management program seeks to “help all members of Team CDOT be successful with each and every change which impacts them.” CDOT’s people-centric approach to change management highlights the two-way flow of the information system. Information can flow from project leads, to change agents, to supervisors, and finally to employees. However, information and ideas can also originate with the employees and flow back to the project leads. This encourages engagement from frontline workers. CDOT has identified the following contributors to success in change management:
- Active and visible sponsorship
- Frequent and open communication about the change
- Structured change management approach
- Dedicated change management resources and funding
- Employee engagement and participation
- Engagement with and support from middle management
Transportation Commission Engagement
Colorado DOTThe CDOT TAM and Performance Management unit works very closely with the Colorado Transportation Commission, which represents all of the geographic regions in Colorado. Each member of the commission is appointed by the governor and confirmed by the state senate. The commission meetings are open to the public so that all customers of the state’s transportation system are welcome to attend. This promotes participation and transparency between the DOT and its customers. The meeting agenda and materials are available on a website that CDOT manages (https://www.codot.gov/about/transportation-commission/). In the past, the Commission had a designated TAM subcommittee, but due to the priority of TAM, it is now an integral part of the full Commission’s regular business and no longer a subcommittee.
Read more in the chapter: 3.2.2 External Coordination
Data Governance
Connecticut DOTCTDOT established a data governance structure with an initial focus on creating a Transportation Enterprise Database (TED). The vision for the TED is to:
“Create an accessible transportation safety and asset data enterprise system where authoritative data sets are managed by data stewards and formatted for consumption and analysis in a manner that allows stakeholders to use tools that are both effective and meet their business needs.”
CTDOT’s Data Governance Structure is made up of:
- An Executive Oversight Committee, chaired by the agency Chief of Staff, with membership consisting of the agency’s bureau chiefs.
- A Data Governance Council, with members representing key agency functions including Policy and Planning, Asset Management, Engineering and Construction, Maintenance, Traffic, Safety Management, Finance and Administration, Public Transportation, and Information Technology. CTDOT uses consultants to facilitate.
- Data owners and stewards.
The initial charge of the Data Governance Council was to “Prioritize safety and asset data governance solutions to provide the foundational tools necessary to expand enterprise data participation across all disciplines within the agency.” The Data Council is responsible for:
- Identifying data being collected and maintained agency wide.
- Documenting data standards and coordinate development of new standards.
- Developing guidance for data dictionaries, user manuals, and training programs.
- Establishing quality control/quality assurance (QC/QA) processes.
- Facilitating the integration and interoperability of information between authoritative roadway inventory databases and the Department’s enterprise wide data system.
- Informing the Executive Committee of emerging data priorities and how they best might be addressed.
- Reporting to the Executive Oversight Committee as needed to make recommendations regarding data governance challenges or technology opportunities.
Data Owners:
- Have supervisory, administrative, and technical control over a dataset.
- Are responsible for the oversight of the collection, storage, maintenance, and implementation of business rules / managing its use including rules for how data will be exposed for general public consumption.
- Ensure access to the data asset is authorized and controlled.
Data Stewards are responsible for the management of data assets on a day to day basis in terms of content, update and data extract processes, data migration to TED and for the development of metadata. They ensure that:
- There are documents highlighting the origin and sources of authoritative data and completes each metadata element.
- Data has a collection and a maintenance cycle defined.
- Data quality processes are in place.
- Data is protected against unauthorized access or change.
Visualizing Asset Performance at a Glance
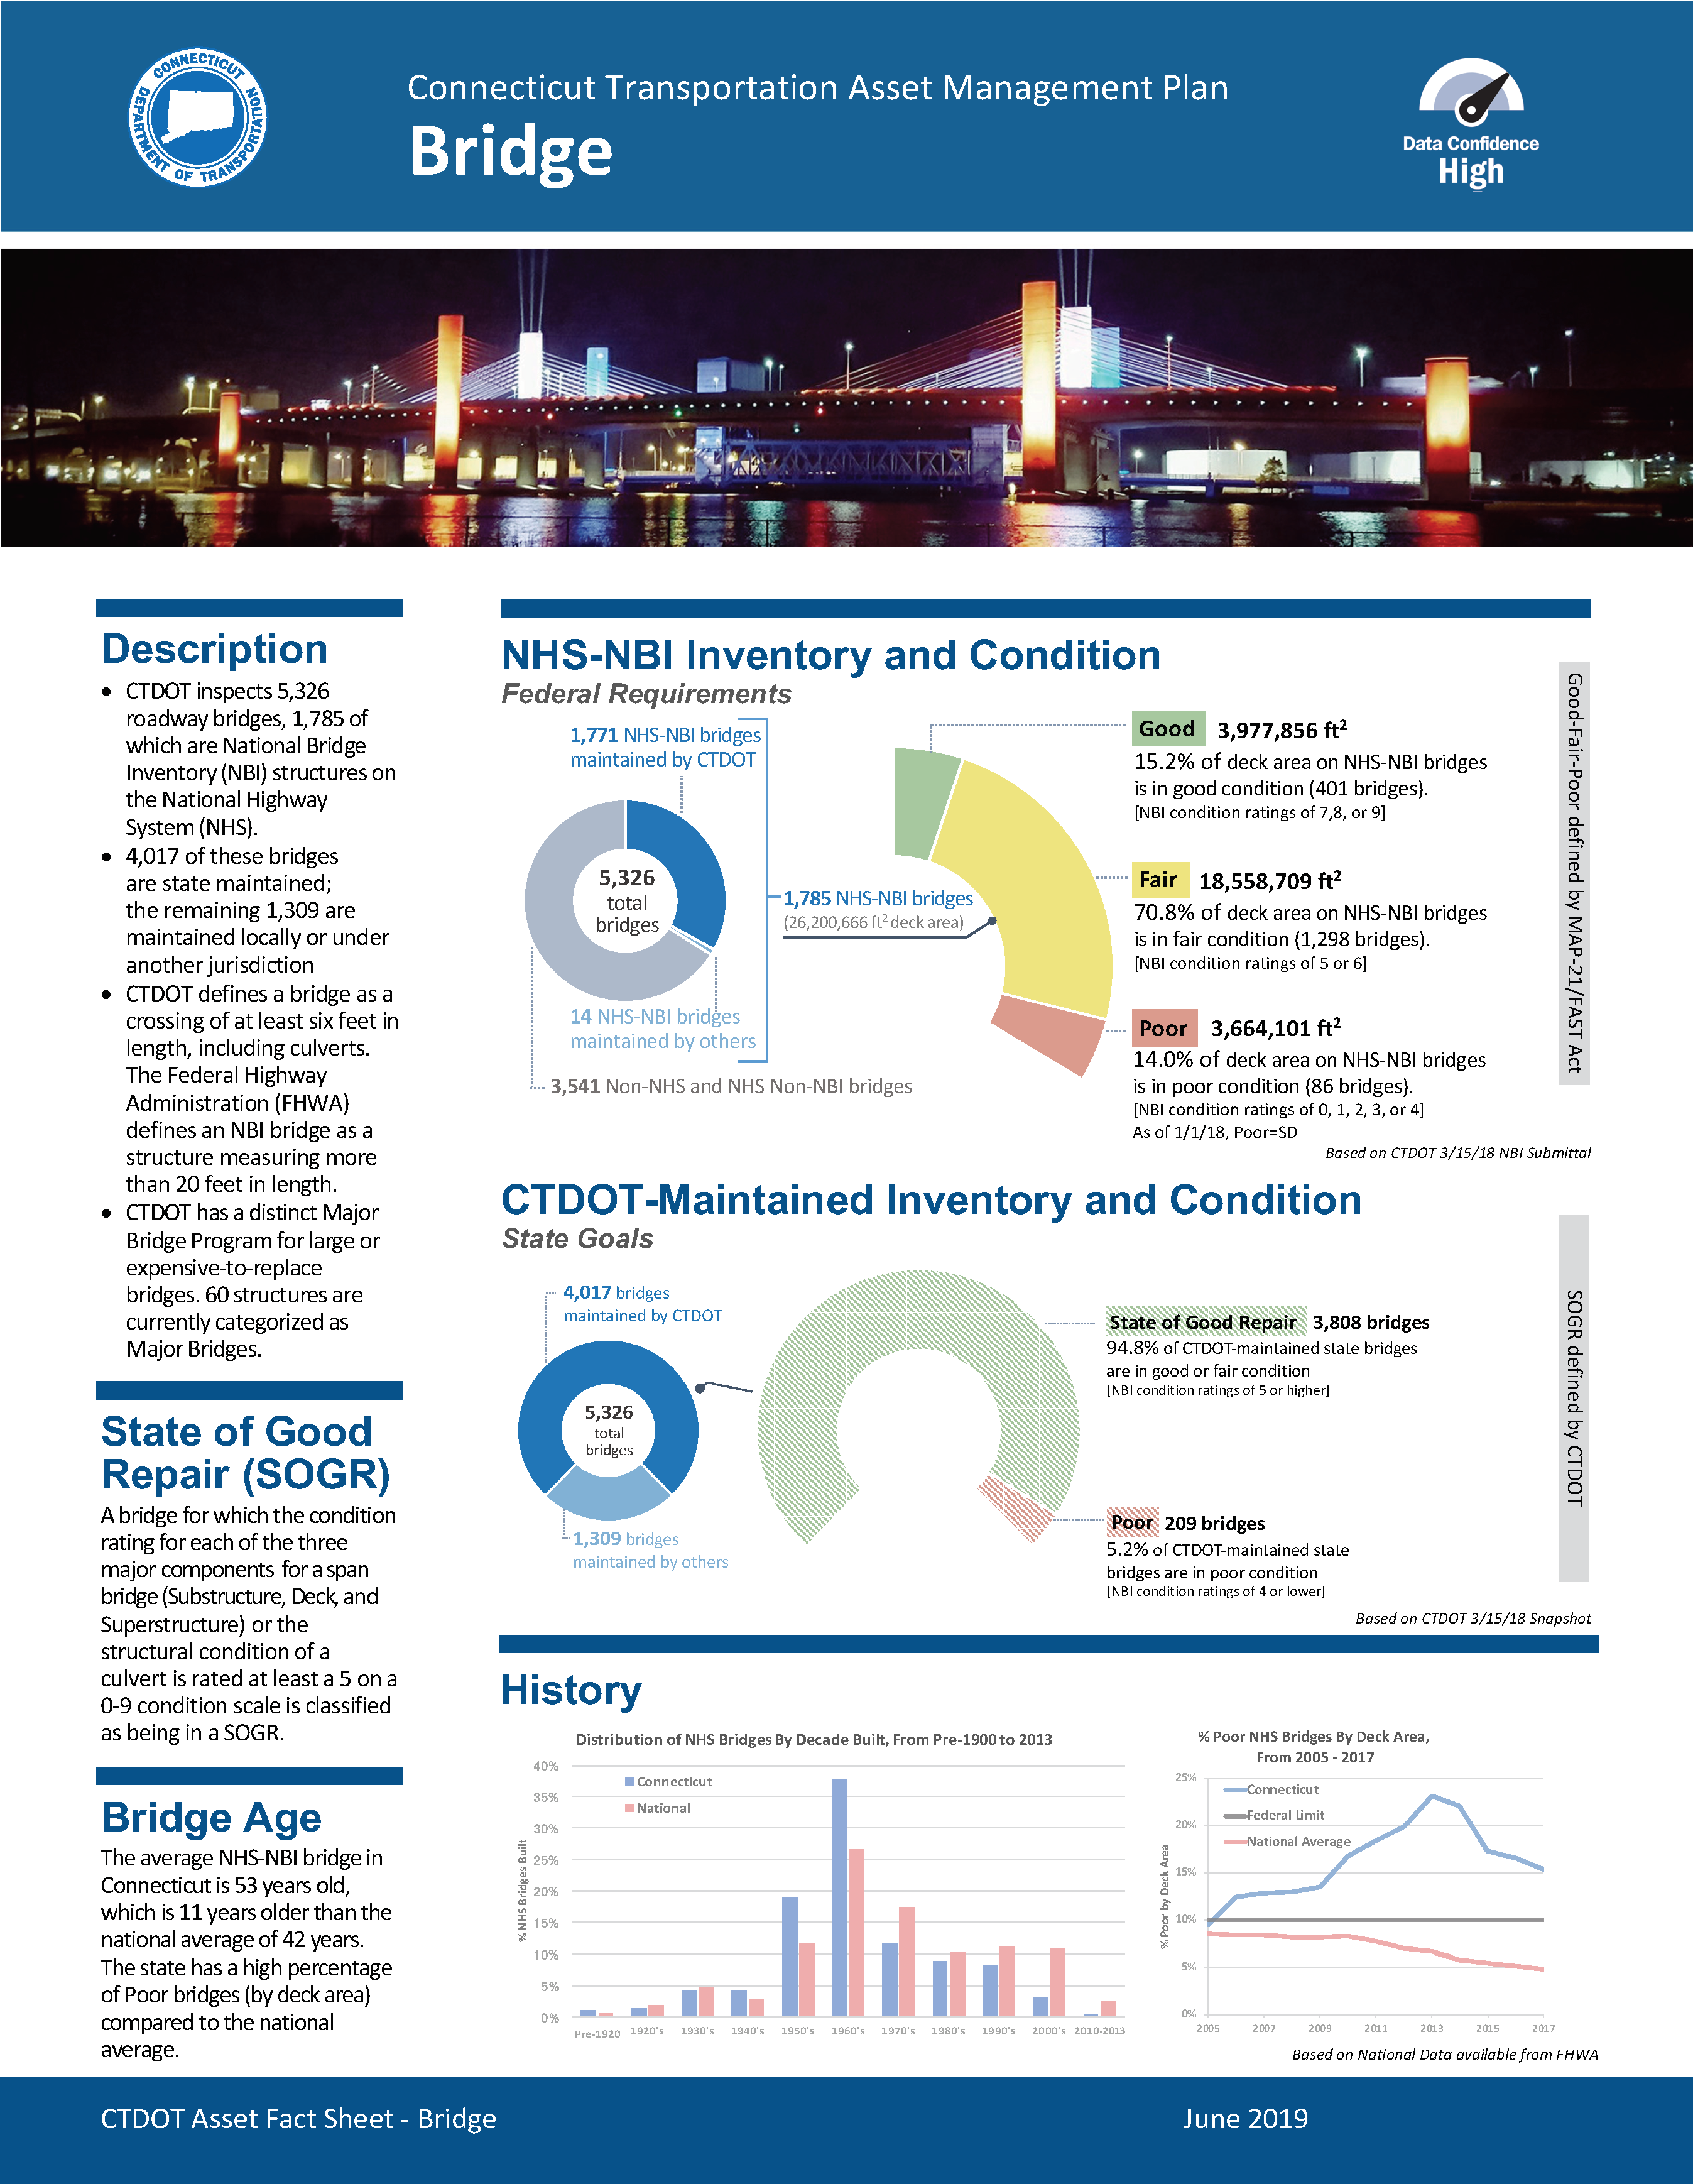
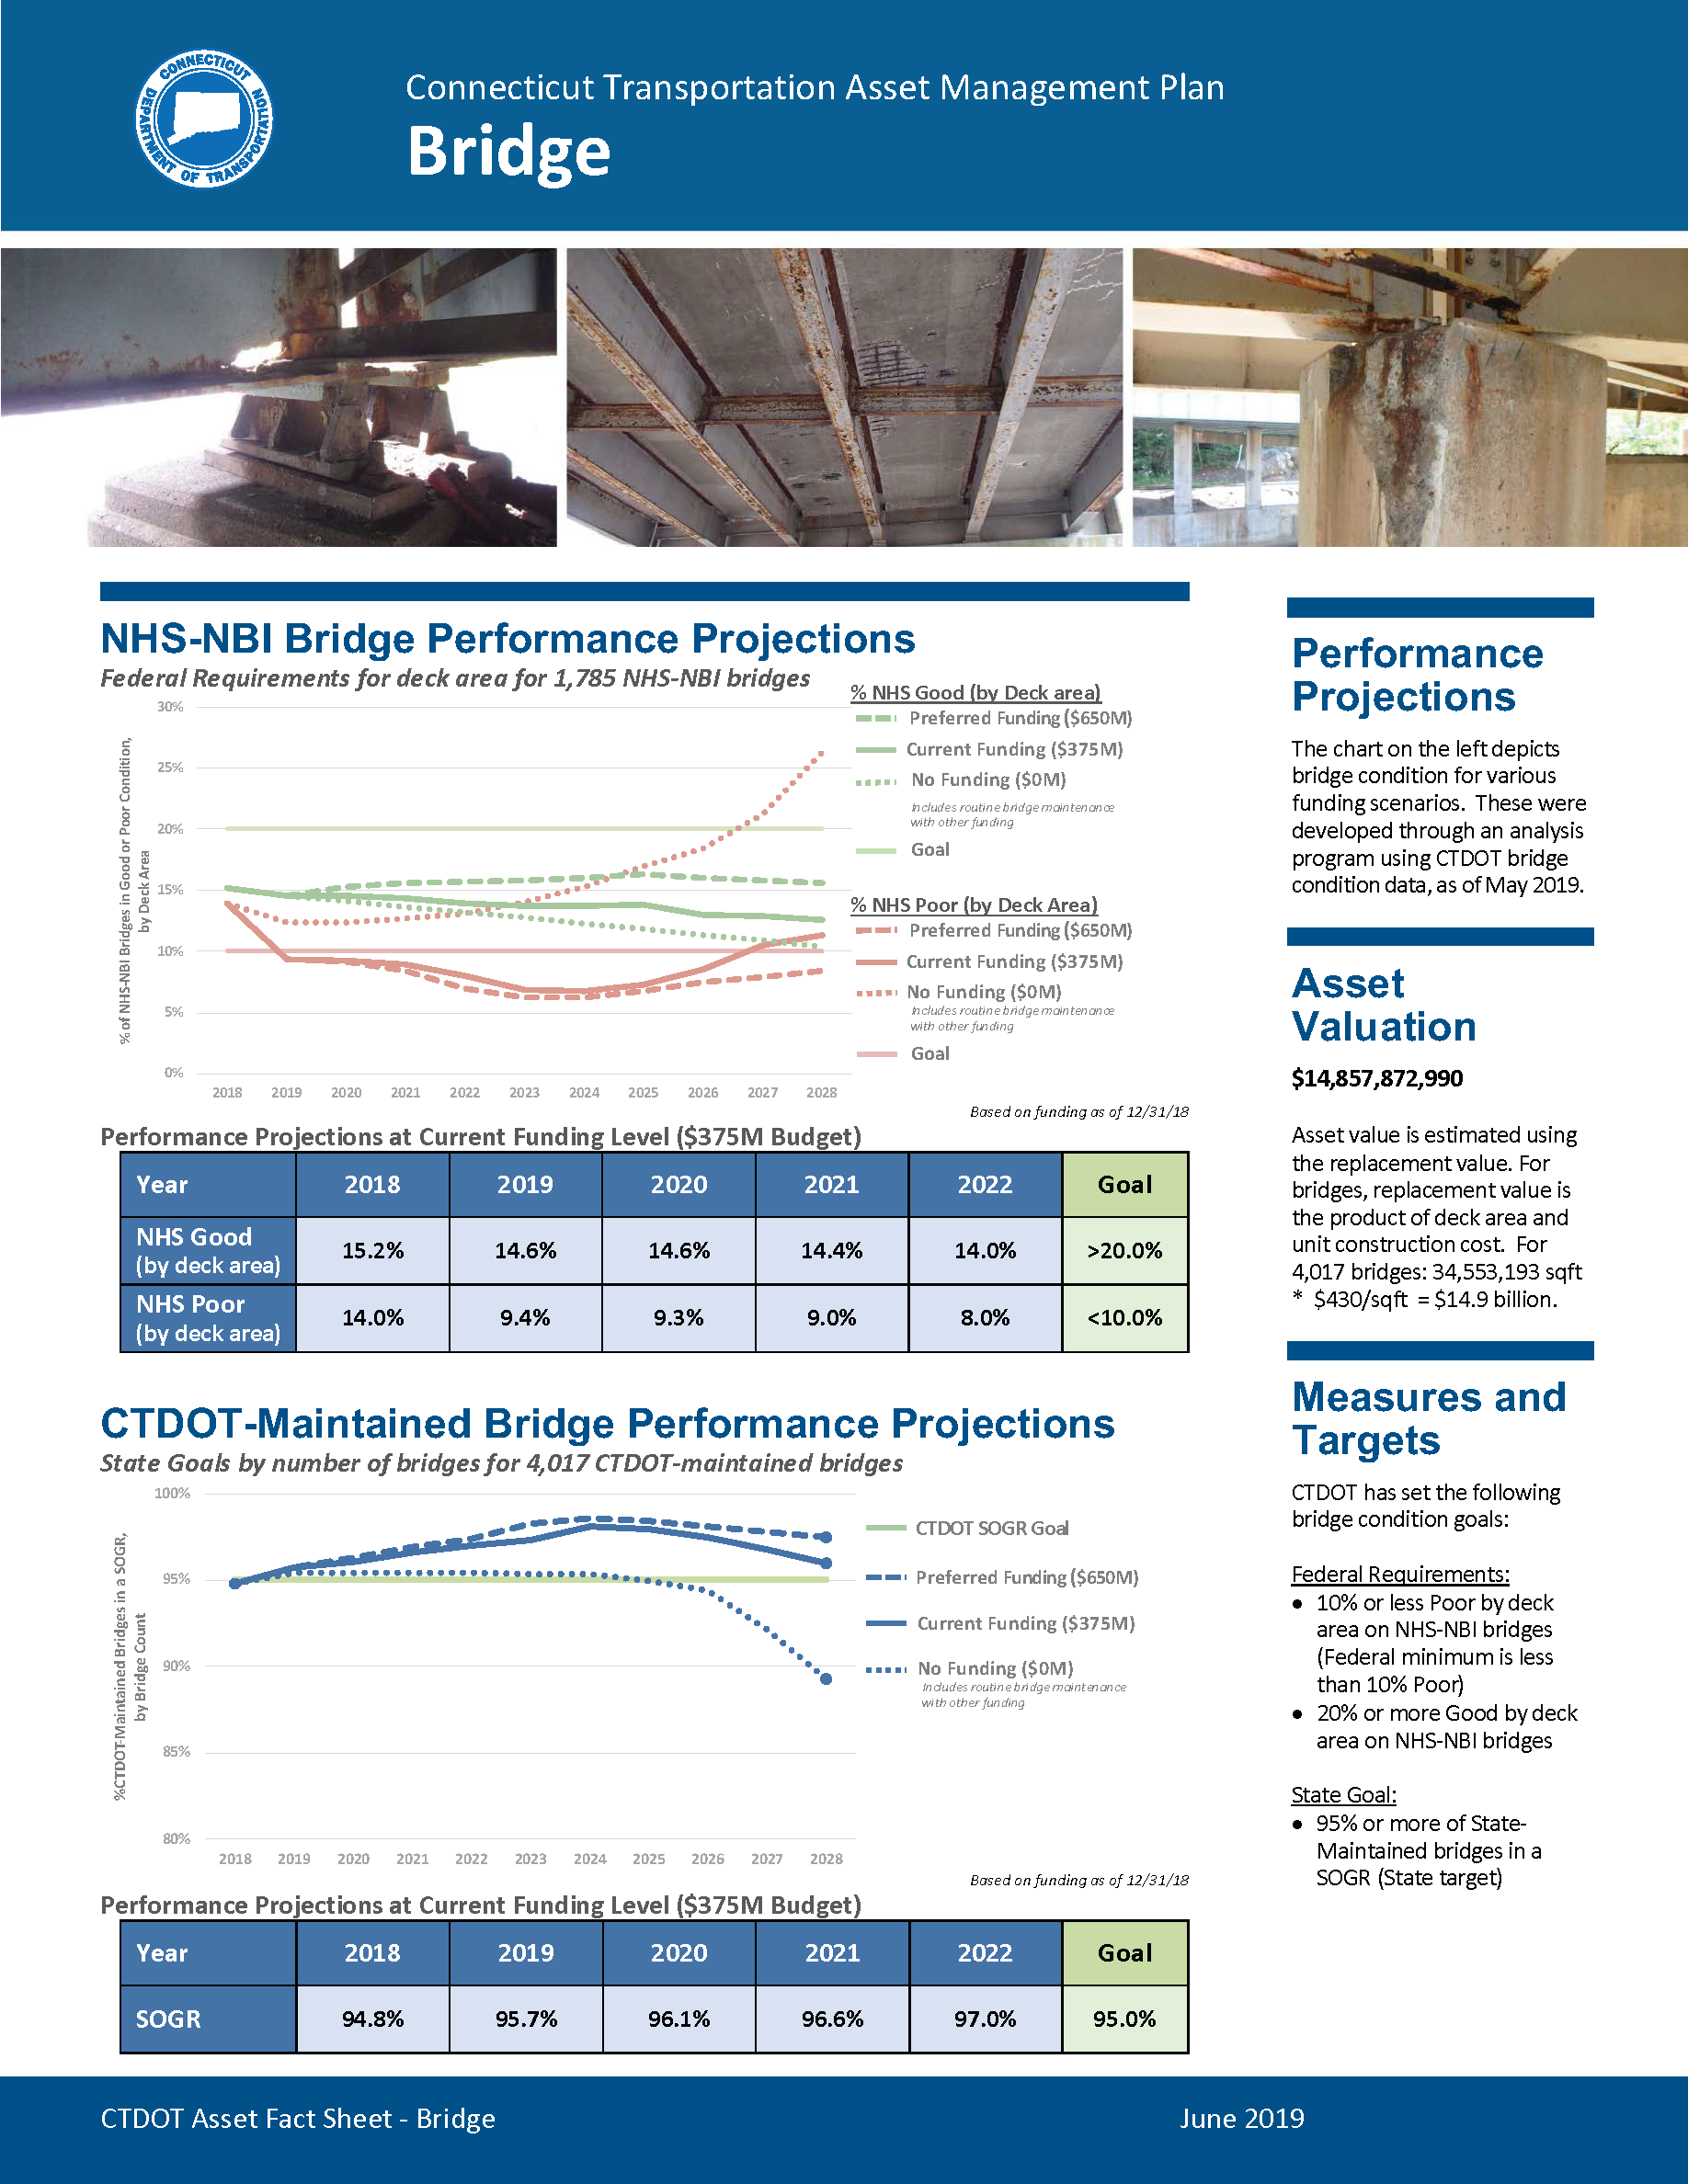
Connecticut DOTTo complement the Connecticut TAMP, Connecticut DOT (CTDOT) developed a series of asset Fact Sheets providing at-a-glance summaries of asset inventory and condition, State of Good Repair definitions, performance projections, targets and asset valuation for bridges, pavements, and five additional assets included in the TAMP. The asset Fact Sheets pair simplified graphs and other information displays with supporting contextual detail; a format that helps communicate CTDOT’s TAM approach to policy makers, executives, and other non-technical stakeholders.
Source: Connecticut DOT. 2018. Asset Fact Sheet.
Read more in the chapter: 7.3.1 Designing Effective Reports and VisualizationsCompetencies and People - Connecticut
Connecticut DOTThe CTDOT TAM data lead in the agency started his career in CTDOT’s bridge design unit and moved his interest to the AEC (architecture, engineering, construction) applications area. The competencies he has built in information technology and data combined with his business understanding of transportation assets are important in helping CTDOT’s TAM program roll out tools that support TAM decision-making. The roll out of these tools is in parallel to capital project delivery enhancements that produce continued efficiencies for the entire delivery team.
Read more in the chapter: 3.1.3 CompetenciesAsset Management Organizational Models - Engineering Office
Connecticut DOTThe Connecticut DOT TAM unit resides in the Bureau of Engineering and Construction and reports directly to the Office of the Chief Engineer. The TAM Unit works with asset stewards, designated for each asset, to coordinate TAM activities across the Department.
Read more in the chapter: 3.1.1 Organizational Models
Incorporating Equity Into a TAMP
DC DOTDCDOT adopted an equity statement to ensure public investments in transportation justly benefit all residents, visitors, and commuters. In putting DDOT’s equity statement into practice, the agency has developed an equity assessment tool. In their TAMP, they explored a means to include social equity into the investment strategies analysis. The team used the social vulnerability index (SVI) in conjunction with DDOT’s pavement management system to investigate how pavement projects could be distributed equitably across the district. The SVI was developed by the CDC and relies on factors, including socioeconomic status, household composition, minority status, English language proficiency, housing, and transportation, to determine how well a community can respond when facing disaster, disease, or crisis.
Additional Resources
- King County Metro – Mobility Framework and Equity Cabinet: https://kingcounty.gov/depts/transportation/metro/about/policies/mobility-framework.aspx
- WSDOT Strategic Plan: https://wsdot.wa.gov/about/secretary-transportation/our-strategic-plan
- Caltrans Equity Statement: https://dot.ca.gov/about-caltrans/equity-statement
Data Categories
DC DOTWashington, DC has established four levels of data. By default, data is considered to be open and shareable.
- Level 0. Open (the default classification)
- Level 1. Public, Not Proactively Released (due to potential litigation risk or administrative
burden) - Level 2. For District Government Use (exempt from the Freedom of Information Act but not
confidential and of value within the agency) - Level 3. Confidential (sensitive or restricted from disclosure)
- Level 4. Restricted Confidential (unauthorized disclosure can result in major damage or injury)
Enterprise Information Management
Florida DOTFlorida Department of Transportation (FDOT) launched a statewide initiative to better manage and integrate agency data. This effort combines the resources, goals, and objectives of Florida’s Technology and Operation Divisions into the initiative known as ROADS, which stands for:
- R—Reliable, accurate, authoritative, accessible data
- O—Organized data that produces actionable information
- A—Accurate governance-produced data
- D—Data and technology integration
- S—Shared agency data to perform cross-functional analysis
The agency has created processes, procedures, and guidelines so that all data (financial, safety, project, program, assets, etc.) are organized and accessible. Florida’s steering committee, known as RET (ROADS Executive Team), is led by the agency’s Chief of Transportation Technology and Civil Integrated Management Officer. The committee, which includes district secretaries, financial and planning executives, and operational directors, is charged with governance leadership and instituting processes that will change the culture of the agency by converting data to knowledge.
ROADS is being implemented incrementally, through a series of 6-month initiatives. One initiative related to asset management is to standardize inventory attributes for 120 different classes of infrastructure assets and the agency’s approximately 170 enterprise software applications. Part of this effort is to determine specific authoritative source data to include in a new data warehouse. The data warehouse will provide a single authoritative site for sharing the accurate data.
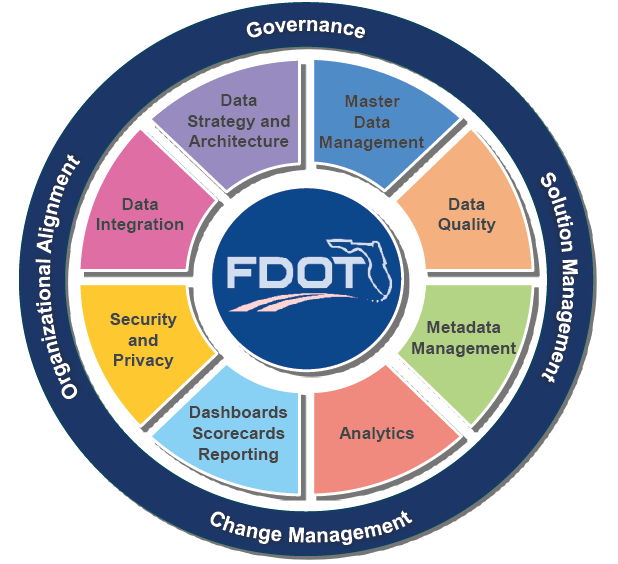
Through the ROADS initiatives, Florida DOT has created a strategic direction for data integration covering data stewards, division responsibilities, asset inventory, business system integration, and an implementation roadmap. By coordinating its efforts, the agency is able to maximize the value of its data while streamlining processes for data collection, management, and dissemination.
Florida DOT Enterprise Information Management
Source: Florida DOT. 2019
Read more in the chapter: 7.4.1 Fundamental Concepts and PrinciplesInventory Update Requirements
Florida DOTTo ensure that the asset inventory remains current, the Florida DOT assigns district personnel responsibility for maintaining asset inventories and establishes guidance that no data in the inventory can be more than five years old. For new construction projects, it is required that the inventory be updated within 90 days of completion. The Florida DOT district offices develop a Quality Control (QC) plan and perform a QC check on the data at least once a year. The Florida DOT Central Office develops a Quality Assurance Review (QAR) plan and performs a QAR on the district’s QC process and spot checks the data in the field. As a result of these requirements, the Florida DOT has a high degree of confidence in the numbers used for budgeting activities.
Read more in the chapter: 6.4.2 Establishing Business Processes to Support Work History and Cost Tracking
TAMP Communication Plan
Georgia DOTThe Georgia DOT TAMP, published in 2014, included a communication plan to promote awareness of TAM and communicate the benefits of TAM practices. The communication plan highlights the goals and target audiences of communication and includes the key messages that are intended to be conveyed through various means. The main element of the communication plan is a table that lists the audience, communication strategies, and timeframe for the particular strategy. For example, in the near term the agency wants to have one-on-one meetings with members of the State Transportation Board regarding TAM priorities in their respective districts. Finally, the communication plan also contains brief measurement tools to gauge the reach and effectiveness of the communication efforts.
Read more in the chapter: 3.2.3 Communication
Data Assessment
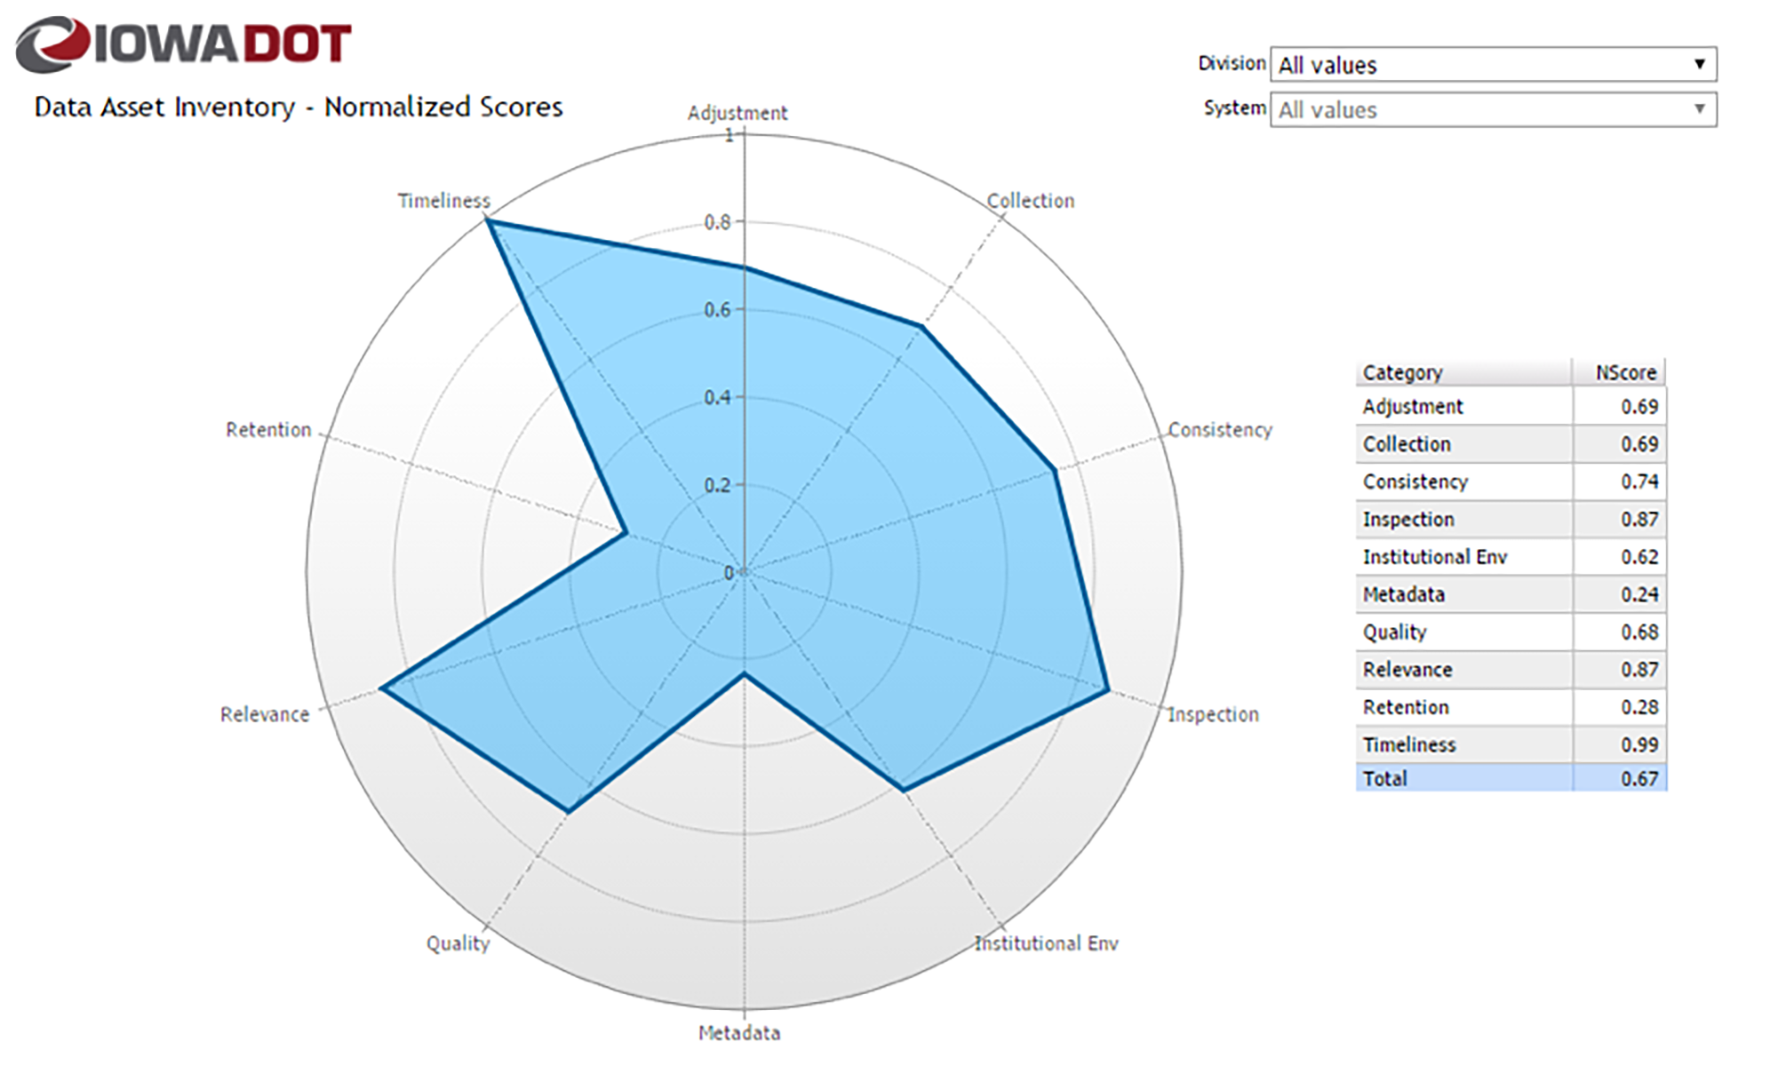
Iowa DOTIowa DOT conducted a detailed data maturity assessment for over 180 data systems. Assessments were based on a standardized questionnaire administered to data stewards and custodians. The questions covered data quality, availability of metadata, whether a data retention plan was in place, the degree to which data collection was automated, and several other factors. Charts were produced showing maturity scores for each system, with roll-ups at the division level. This tool helps the agency track their progress over time and identify specific data improvements to pursue.
Sample Data Assessment Summary Radar Chart
Source: Iowa DOT. 2019
Read more in the chapter: 7.4.3 Assessing Data Management and Governance MaturityLeadership Vision
Iowa DOTWhen the Iowa DOT TAM program was established, agency leadership prioritized the creation of a world-class asset management program and decided to address TAM implementation as a top-level organizational change initiative. This leadership focus and support allowed Iowa DOT’s TAM team to have authority throughout the agency, address organizational improvement needs, and focus on sustainability by building TAM governance.
Impact of Inflation on Road Funding
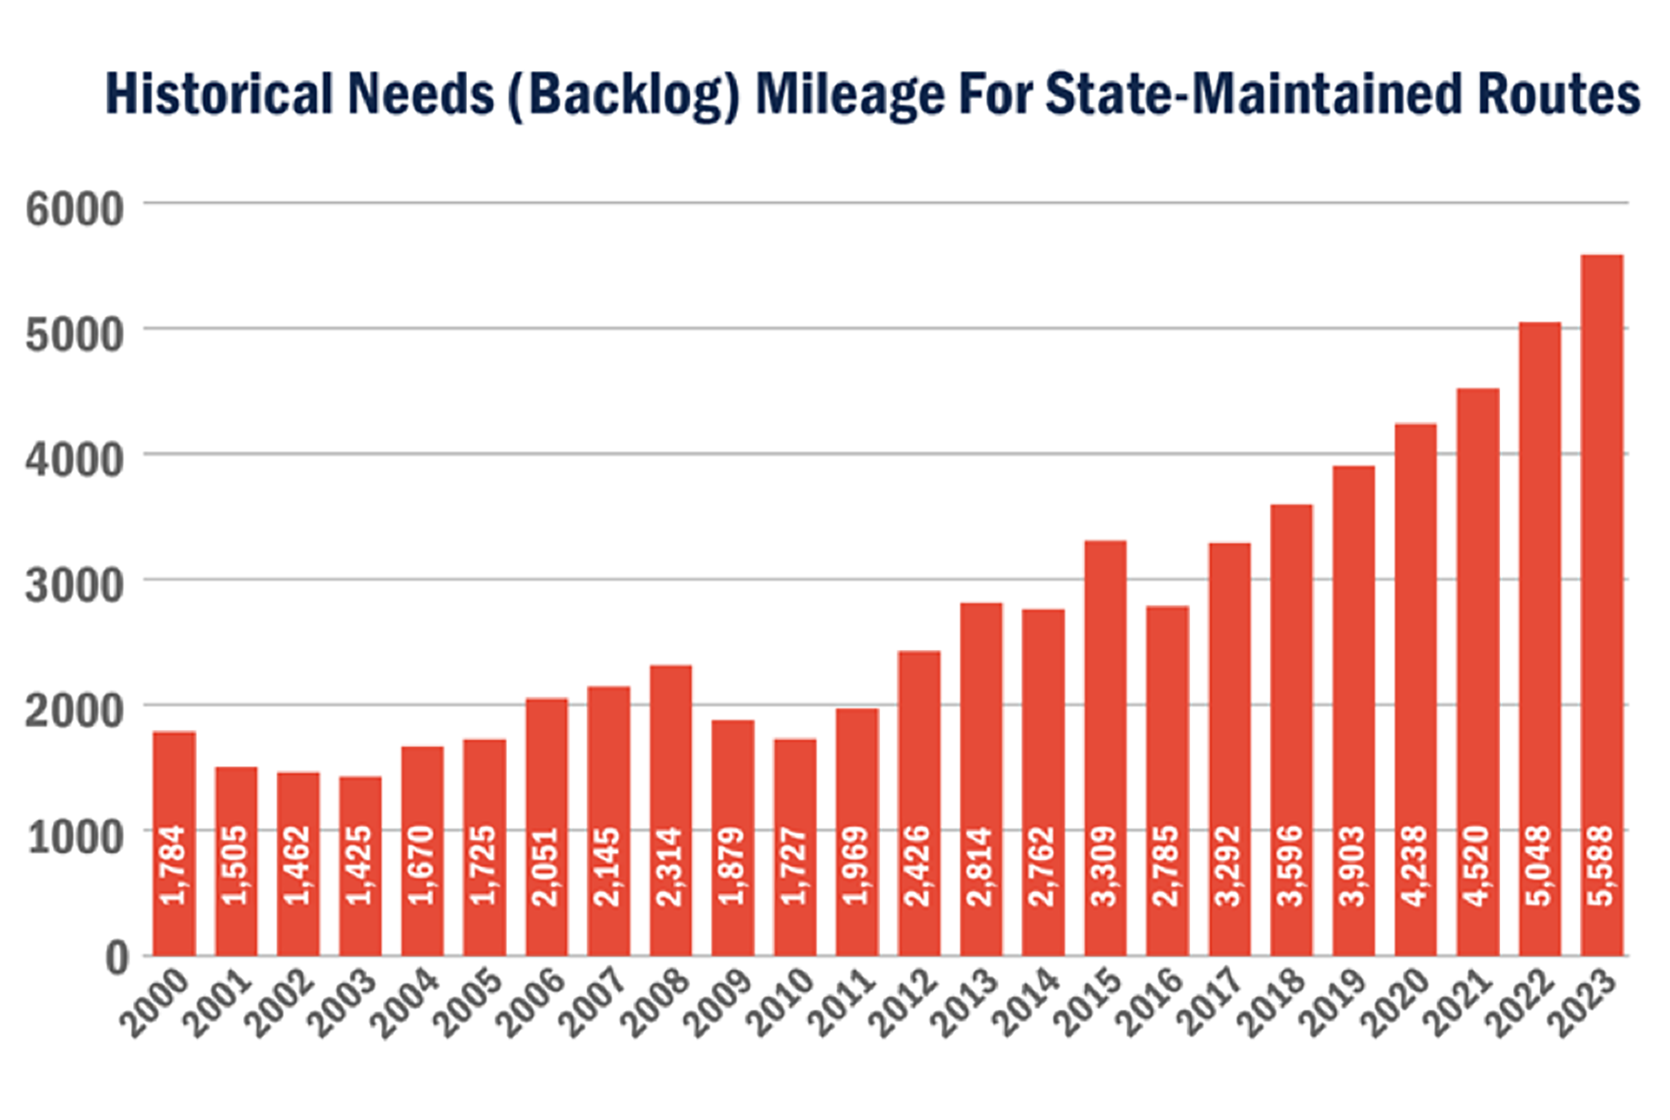
Illinois DOTThe Illinois DOT used a graph showing the number of miles of state-maintained roads in need of unfunded rehabilitation or reconstruction, which was referred to as the backlog. The graph, shown in the figure to the right, illustrates the fact that the backlog was growing over time due to the inadequacy of funding. The increasing trend in backlog prompted the Illinois DOT to reconsider its approach to selecting projects and treatments, moving towards the increased use of preservation treatments to slow the rate at which pavement conditions drop into a backlog condition. In addition to the change in treatments, the Illinois DOT developed a new pavement performance measure based on the percent of the network in good enough condition to be a candidate for a preservation treatment. The change in performance measure was intended to shift funding priorities from deteriorated pavements to those that could be kept in good condition for a longer period of time. The changes were documented in the Illinois DOT’s April 2018 Transportation Asset Management Plan (http://www.idot.illinois.gov/transportation-system/ transportation-management/planning/tamp) and were used in developing the fiscal year 2019-2024 Multi-Year Proposed Highway Improvement Program. In addition, new software tools are being acquired to further support this improved approach to managing pavements and bridge assets.
Source: Illinois DOT Transportation Asset Management Plan. 2018.
Read more in the chapter: 6.3.2 Using Trend Data to Make Program Adjustments
Overhead Sign Structures – Condition-Based Management
Indiana DOTOverhead sign structures are critical to safe and effective highway performance since they support signs, cameras, sensors and other equipment in support of routine and emergency operations. These structures typically have long service lives, but failure risk exists if they are not maintained. Indiana DOT found that failure to their overhead sign structures could be effectively mitigated through routine, real time condition monitoring and condition forecasting for predicting failure. Therefore, the Indiana DOT uses a condition-based approach for maintaining its overhead sign structures.
Indiana DOT’s condition-based maintenance approach involves the steps listed below to ensure the overhead sign is installed corrected, material specifications are met, and the connection to the ground is secure:
- Professional engineers perform inspections
- An asset inspection report is developed
- The asset inspection reports are submitted to the districts
- The districts review the reports and prioritize work activities
- Work orders are developed to address the highest-priority needs
- In-house crews or local contractors perform the work
As a result of the DOT’s condition-based maintenance approach, the department realized an increase in the amount of collaboration between districts and an improvement in how overhead sign structure repairs and replacements are monitored and prioritized.
Source: FHWA (2019). Handbook for Including Ancillary Asses in Transportation Asset Management Programs (pending publication in 2019).
Read more in the chapter: 4.2.1 Life Cycle Management Approaches
Pavement Life Cycle Management
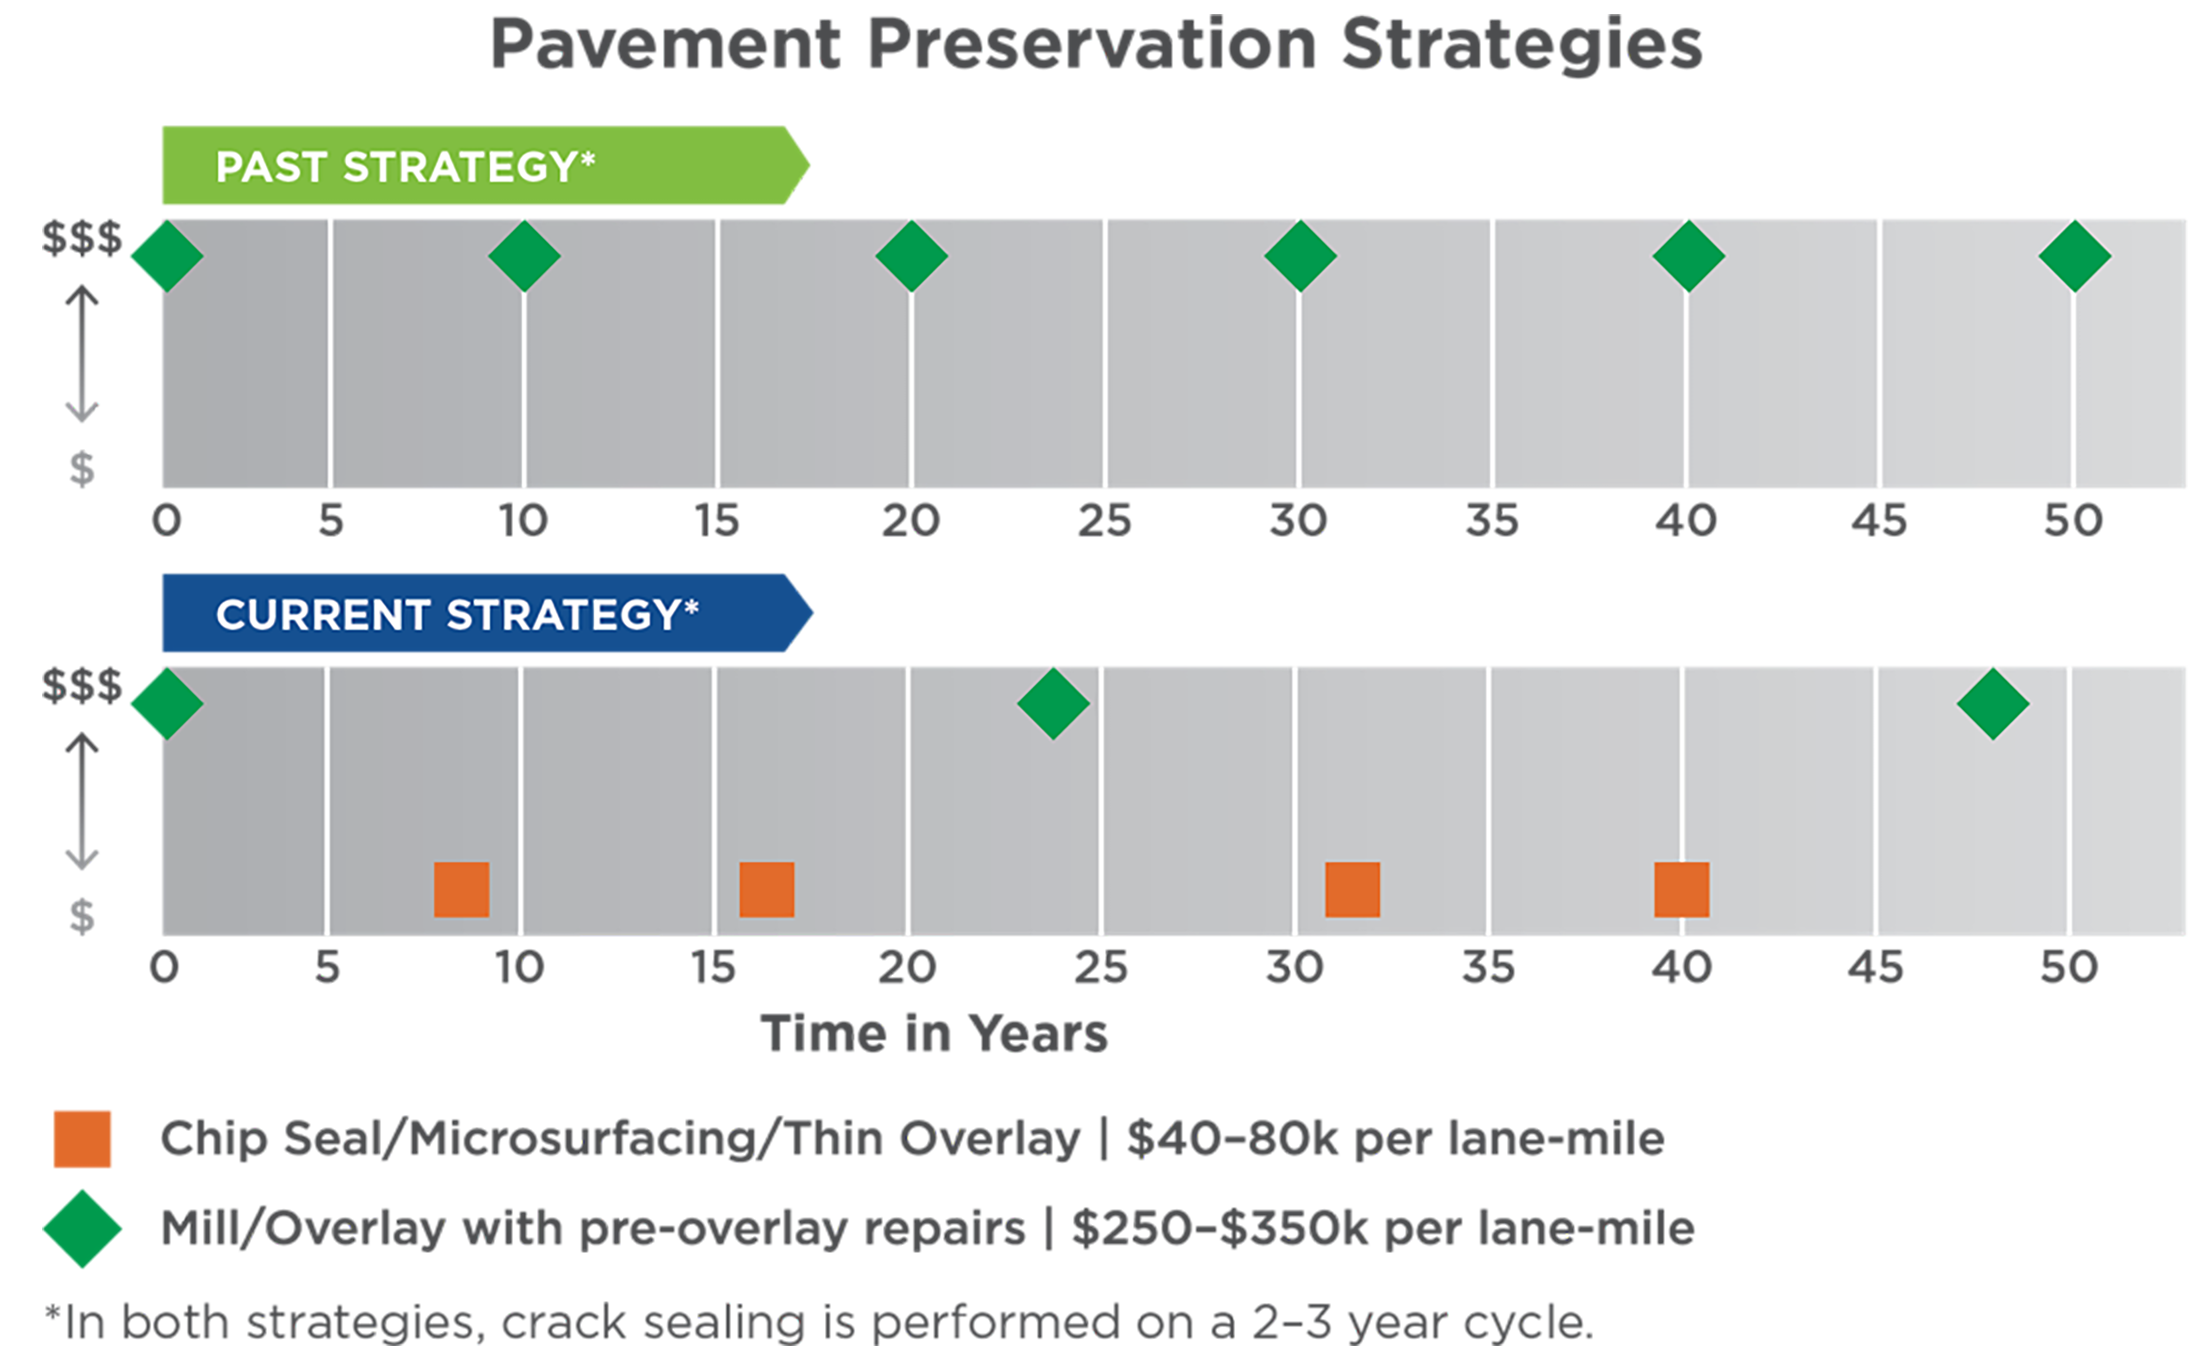
Kentucky Transportation Cabinet (KYTC)In the early 2000s, KYTC found that the cost of hot-mix asphalt (HMA) was increasing faster than its budget to maintain pavement conditions. In response, KYTC evaluated the feasibility of strategies that relied heavily on preventive maintenance overlays such as thin HMA overlays (< 1 inch), chip seals, cape seals, and slurry seals. KYTC found that while the costs of these treatments were substantially less than a traditional HMA overlay, their service lives were only marginally shorter. As a result, the agency began increasing the use of these treatments on its secondary system. As part of developing its risk-based TAMP in 2018, KYTC evaluated life cycle strategies, as shown in Figure 4.3 Analysis of KYTC Future Costs Under Two Strategies that expanded the use of preventive maintenance overlays to its parkway and interstate pavements. The analysis results led the agency to select a life cycle management strategy that maximizes the use of preventive maintenance overlays on secondary roads and parkways and increases their use on interstate pavements over time. As shown in Figure 4.3, this new life cycle strategy achieved conditions over the 10-year TAMP analysis period that would have cost an additional $644 million if they had continued to rely on traditional 1- to 2-inch HMA overlays. By implementing these improved strategies, KYTC has significantly reduced the risk that the infrastructure will reach an unsustainable cost to maintain in the future.
Source: KYTC Transportation Asset Management Plan, 2018. http://www.tamptemplate.org/wp-content/uploads/tamps/048_kentuckytc.pdf
Read more in the chapter: 4.1.1 Defining Life Cycle Management
Developing a Resilient Life Cycle Strategy for Pavements
Maine DOTMaine is a cold-weather state with soils that are susceptible to severe frost conditions during winter months. In cooperation with FWHA and its Transportation Engineering Approaches to Climate Resiliency (TEACR) effort, Maine DOT undertook a project to assess the impacts of changing climate on the performance of pavements and develop strategies to offset those changes. The study looked at anticipated changes in both temperature and precipitation over the course of the 21st century. The study followed the ADAP process as shown in figure 4.6. The study indicated that anticipated climatic changes will lead to moderate changes in pavement performance. The study identified both engineering and operational adjustments Maine DOT can adopt to address these changes. The full report can be found on FHWA’s website at: https://www.fhwa.dot.gov/environment/sustainability/resilience/ongoing_and_current_research/teacr/me_freeze_thaw/
Read more in the chapter: 4.1.3 Developing Life Cycle Strategies
Cost Savings through UAV Bridge Inspection
Michigan DOTUnmanned Aerial Vehicles (UAVs) offer several advantages for asset data collection. They can fly into confined spaces such as entrances to sewers and culverts to collect data and images. They can collect high resolution images, thermal images and LiDAR. LiDAR can be used to produce three dimensional images that allow for accurate measurements. Thermal images can be used to detect subsurface concrete deterioration.
Michigan DOT analyzed the benefits of using UAVs for bridge inspection, and concluded that using a UAV for a deck inspection of a highway bridge reduces personnel costs from $4600 to $250. A traditional inspection would take a full day and require two inspectors, and two traffic control staff to close two lanes of traffic. The same inspection using a UAV takes 2 hours and would require only a pilot and a spotter. An additional savings of $14,600 in user delay cost was estimated based on delays associated with shutting down one lane of a four lane, two way highway bridge in a metropolitan area for a bridge inspection.
Read more in the chapter: 7.2.2 How to Collect DataMichigan's Resource Allocation Process
Michigan DOTMichigan DOT recently introduced principles of performance-based contracting to their routine highway maintenance delivery. The focus of this initiative was on developing a better understanding of performance, providing more consistency of service, encouraging innovation adoption and identifying efficiency opportunities.
To achieve this MDOT developed performance measures for 23 non-winter maintenance activities. They then examined how these activities contributed to the objectives and community outcomes MDOT wanted to achieve (e.g. safety, reliability, economic benefit, and quality of life) and used that analysis to select six initial key measures for which targets were set to focus the effort. The performance monitoring system helped one MDOT region identify unsealed shoulders (ensuring they are even and traversable) as an area requiring improvement. They invested in additional shoulder maintenance in 2015 and from this realized a performance increase of more than 30%.
MDOT is using this performance monitoring approach to better understand the cost of improving its maintenance level of service. The agency is also identifying specific resources to focus in areas where it can achieve a more consistent and safer outcome.
Read more in the chapter: 5.1.3 Prototypical Resource Allocation ProcessIntegrating TAM
Michigan DOTMDOT’s strategic plan has seven strategic areas of focus. A key focus area is System Focus, which aims to provide cost-effective, integrated and sustainable transportation solutions. The first strategy under this focus is to “apply asset management principles to prioritize and implement the most cost-effective transportation investment strategies.” This connection between MDOT’s strategic plan and their TAM program communicates the importance of asset management in how the agency conducts business. It gives TAM a seat at the agency-wide strategic plan monitoring sessions and allows for the resources needed to carry out TAM activities.
Source: Michigan DOT. 2017. MDOT Strategic Plan. https://www.michigan.gov/documents/mdot/MDOT_2017_StrategicPlan_553573_7.pdf
Read more in the chapter: 2.1.1 Integrating TAM Within Agency Strategic Plans and PoliciesProcess Change
Michigan DOTWhen introducing a Maintenance Rating System, Michigan DOT (MDOT) started the change management process early in the project. Agency leadership was consistent and passionate throughout the project. The process was developed with involvement from individuals within each Region, including people in leadership as well as those on maintenance delivery teams. These discussions identified opportunities for consistency and enabled development of a system that represented actual performance and decision making.
The Maintenance Rating System was piloted within one Region that was most proactively seeking the information that the system provided. This enabled any kinks to be ironed out in the system and also developed individuals within MDOT who could train their peers in the system, results, analysis and opportunities for decision making. It also provided data that enabled the Regions to learn from the results, make a change in investment and improve the maintenance level of service delivered. The rating system was named the “Michigan Maintenance Rating System (MiMRS).”
During implementation MDOT identified a specific roles for coordinating and driving the system, and identified individuals within each Region that had shown interest in the system and competency in analytical assessment to be part of a user group to share knowledge and disseminate information. MDOT also shared the results and news stories internally to enable peer comparison and drive consistency. Leadership identified specific funding for projects developed based on the maintenance rating system results.
This process change was part of a broader MDOT approach to Performance Based Maintenance that included implementing a new inventory and maintenance management system. Performance Based Maintenance will enable MDOT to better understand their assets, the cost of maintenance and the cost to make improvements to asset functionality. The goal of Performance Based Maintenance at MDOT is to achieve a needs-based budgeting approach to non-winter maintenance and enable better decision by supervisors and management.
Read more in the chapter: 3.3.2 Understanding the OrganizationStatewide Coordination
Michigan DOTOne way to coordinate and collaborate across external agencies is to establish a statewide council. Michigan’s Transportation Asset Management Council (TAMC) coordinates TAM at the statewide level. It consists of 10 voting members appointed by the state transportation commission. The transportation asset management council shall include two members from the County Road Association of Michigan, two members from the Michigan Municipal League, two members from the state planning and development regions, one member from the Michigan Townships Association, one member from the Michigan Association of Counties, and two members from the Michigan Department of Transportation. (https://www.michigan.gov/tamc).
In addition, Michigan formed the Michigan Infrastructure Council to: coordinate work beyond transportation assets such as water and communication assets; develop the statewide asset management database, and facilitate the data collection strategy for assets (https://www.michigan.gov/mic/).
Read more in the chapter: 3.2.2 External CoordinationAsset Management Organizational Models - Planning Office
Michigan DOTAt Michigan DOT, the asset management function is distributed across the agency, but the TAM lead is in the planning bureau. Locating the TAM lead within planning provides a strong link to strategic investment planning and decision-making.
Read more in the chapter: 3.1.1 Organizational Models
Family of Plans
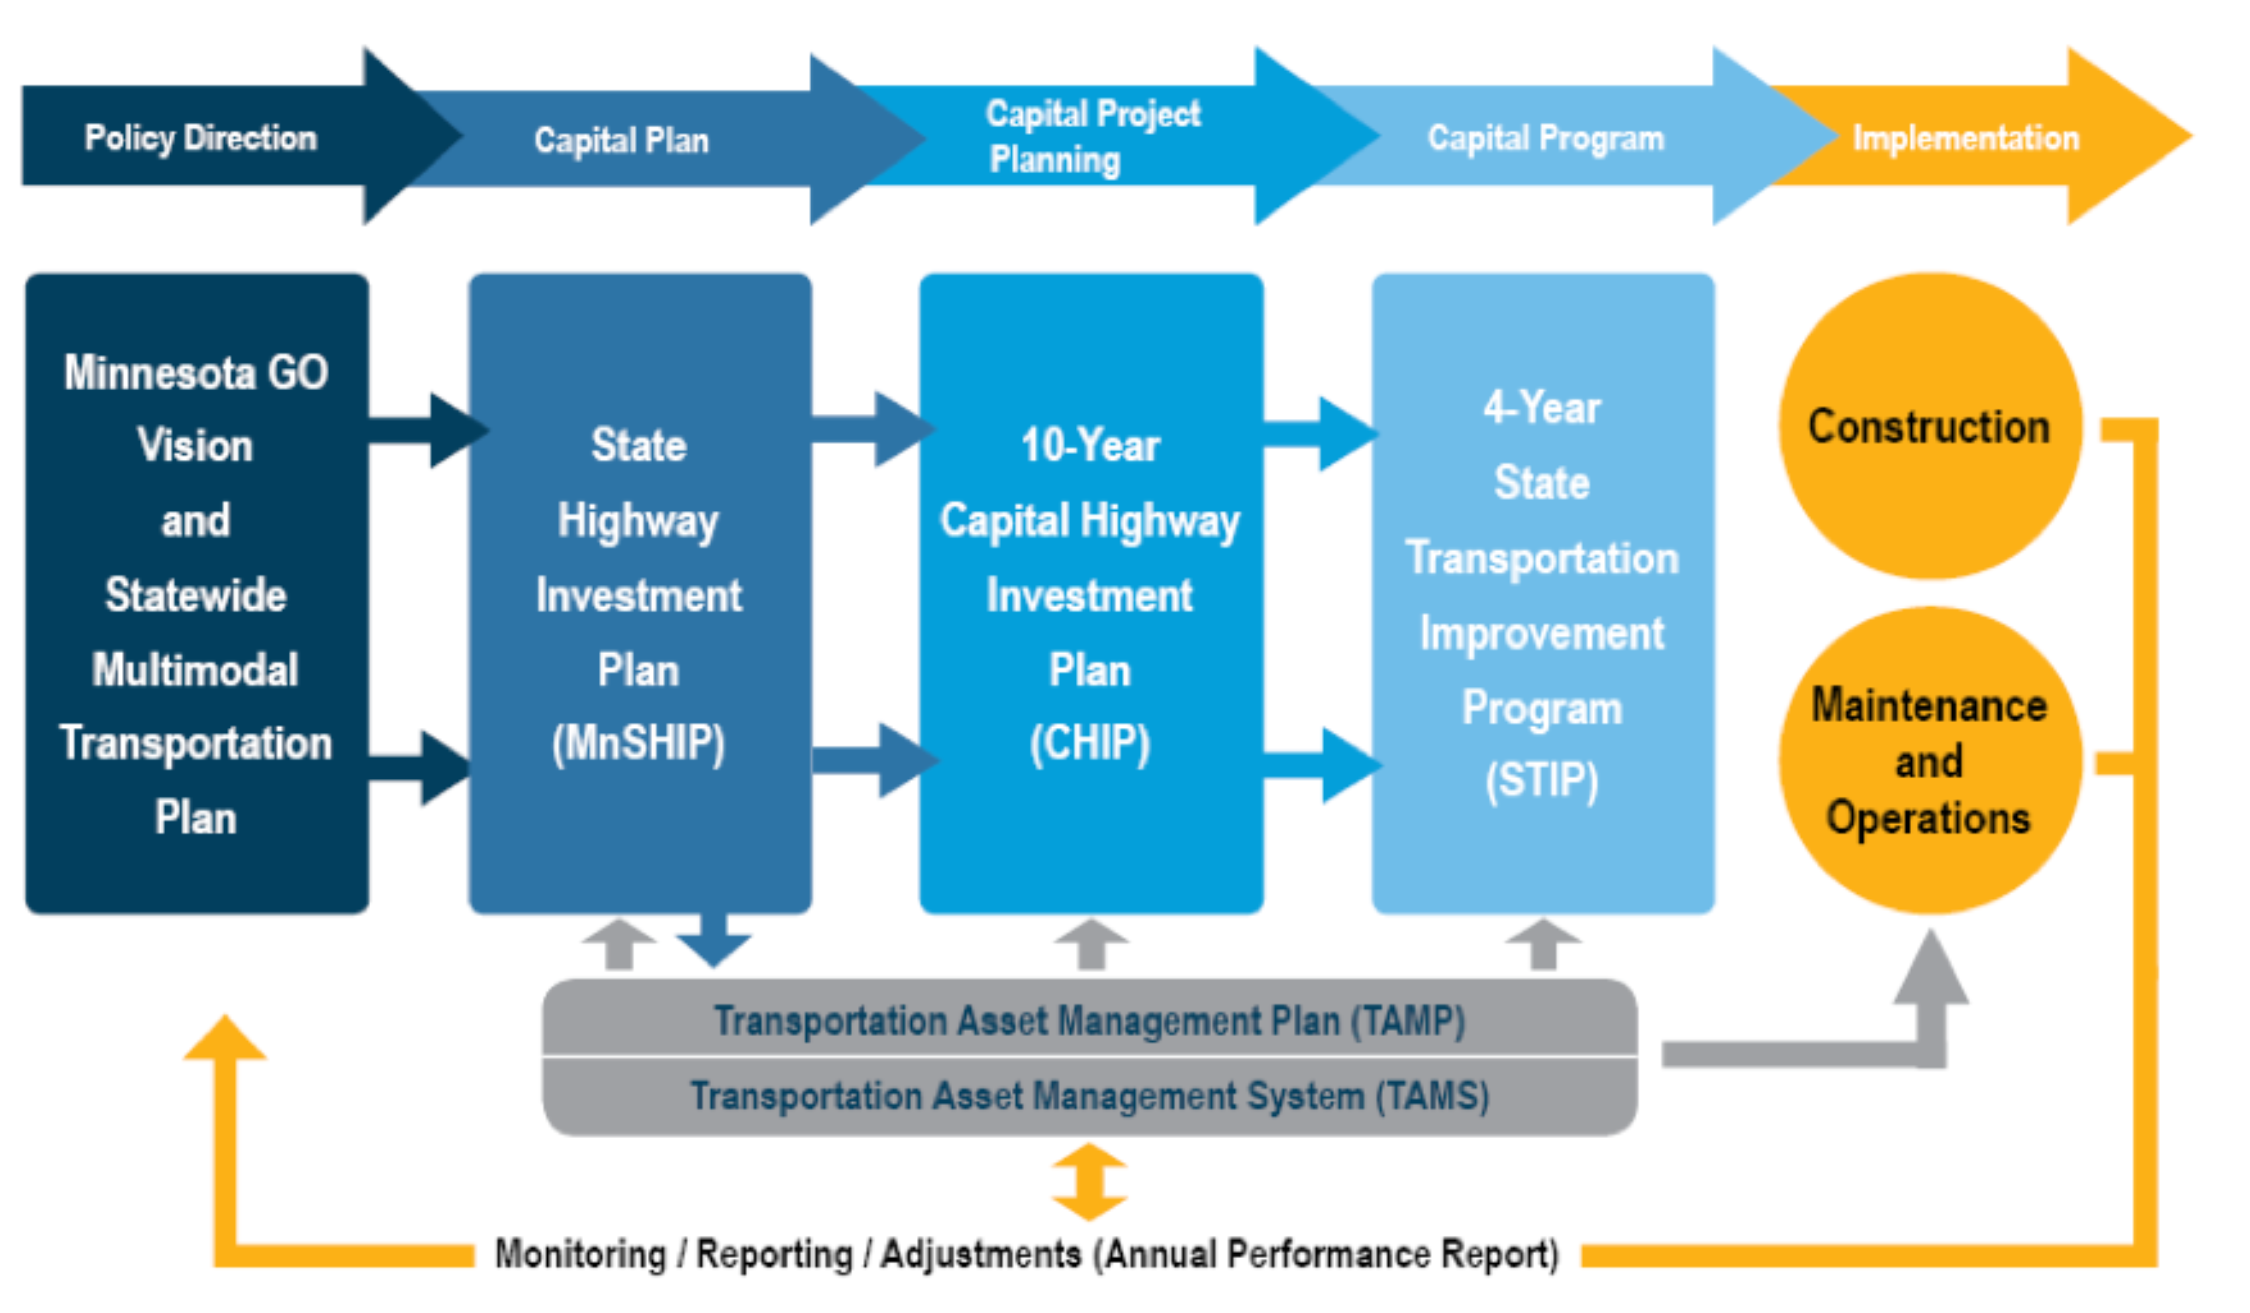
Minnesota DOTMinnesota DOT (MnDOT) practices financial stewardship through a neatly aligned ‘family of plans’ that ranges from the highest level, longest term plan (Minnesota GO 50 Year Vision) to the detailed, short term, project level plans (e.g. STIP). The intentional connections between these plans allows the policy direction set in the Minnesota GO Vision to drive the system plans, capital programs, and operating plans.
The Minnesota State Highway Investment Plan (MnSHIP) is the 20 year investment plan that guides capital improvements in alignment with MnDOT’s vision and the objectives defined in the Statewide Multimodal Transportation Plan (SMTP). MnSHIP allocates funding to 14 investment categories that correspond to five objective areas defined in the SMTP: System Stewardship, Transportation Safety, Critical Connections, Healthy Communities, and Other.
The funding allocation decision process involves modeling different levels of investment to reach specific outcomes for each investment category. MnDOT creates bundles of funding levels for the 14 categories to craft multiple potential investment approaches, each using the same budget and assumptions. Input from public engagement, senior leadership, and key agency staff is used to select the preferred performance outcomes and investment approach.
Following the guidance of the MnSHIP, MnDOT Districts select projects to be included in the MnDOT Capital Highway Investment Plan (CHIP), the first four years of which represent the STIP. A single project can include funding from multiple investment categories. The CHIP is updated annually and includes a comparison of planned and programmed projects with the investment priorities established in MnSHIP. If there is any deviation from the MnSHIP guide, the CHIP offers a narrative explanation. This feedback loop links planned and programmed investments to agency priorities, showing how high level policy direction drives agency decisions even at the project level.
Additional Resources:
- MNSHIP. https://minnesotago.org/final-plans/mnship-final-plan
- Minnesota GO. https://minnesotago.org/index.php?cID=531
- Minnesota SMTP. https://www.minnesotago.org/learn-about-plans/statewide-multimodal-transportation-plan
- Minnesota Family of Plans. https://minnesotago.org
- Minnesota Capital Highway Investment Plan. 2022. https://www.dot.state.mn.us/planning/10yearplan/index.html
Using Computerized Management Systems to Optimize Life Cycle Management
Minnesota DOTIn its 2019 Transportation Asset Management Plan (TAMP), MnDOT went beyond the scope of pavements and bridges as mandated by 23 CFR Part 515, addressing a comprehensive range of assets, including culverts, deep stormwater tunnels, overhead sign structures, high-mast light tower structures, noise walls, traffic signals, lighting, pedestrian infrastructure, buildings, and intelligent transportation system (ITS) components. MnDOT established expert work groups for each asset class to assess data availability, risks, mitigation strategies, measures, targets, and investment strategies. The Transportation Asset Management System (TAMS) was developed to manage asset inventory, condition data, and capture maintenance resources. TAMS integrates asset data, historical expenditures, and decision trees for culvert maintenance, facilitating life-cycle analysis, maintenance demand estimates, and performance evaluation. While traffic signals and ITS assets are being analyzed within TAMS, building management and sidewalk data are stored in separate databases.
Read more in the chapter:Minnesota's Performance Management System
Minnesota DOTThe Minnesota DOT’s performance management system consists of clear policies, performance trend data and performance forecasts to guide investments and operational decisions. The system is designed to (http://www.dot.state.mn.us/measures/):
- Address stakeholders’ desire for accountability and transparency
- Provide more informed decision-making and solutions to increasing challenges
- Enhance customer-responsiveness
- Ensure compliance with legislators' mandates
- Improve internal management
- Facilitate refinement of programs and services
- Set benchmarks for comparison of results
MnDOT uses performance criteria to guide capital investments and annual operational budgets. Transportation system and agency performance reports are regularly reviewed by MnDOT management. The ongoing measurement and review process assists MnDOT in evaluating the efficiency of service delivery and assessing the effectiveness of program activities. This objective-based approach increases transparency, and encourages innovation by keeping the focus on outcomes.
The accountability and transparency provided by MnDOT’s performance management system has contributed to MnDOT’s reputation among elected officials as a trusted partner in addressing challenging issues.
Accountability and transparency are a foundation of success for public agencies. The benefit is increased trust. This can help elected officials view MnDOT as a trusted partner and work together on challenging issues. Confidence in agency decision-processes and results is important to legislators considering new investments.
Read more in the chapter:Integrating Equity in Transportation Decision-Making
MnDOTMinnesota Department of Transportation (MnDOT) has integrated equity into transportation decision-making through its Advancing Transportation Equity Initiative, which seeks to enhance access and opportunities for underserved communities in the state. This initiative is based on community input and feedback received during the development of the 2017 Statewide Multimodal Transportation Plan. The plan identified the reduction of transportation disparities and the incorporation of equity into decision-making processes as high-priority objectives. The 2022 Statewide Multimodal Transportation Plan, along with its internal Strategic Plan, includes additional goals, strategies, and actions to further advance transportation equity. MnDOT is committed to creating an equitable transportation system.
| Acknowledge Inequalities | Defining Transportation Equity: | Proposed Journey |
|---|---|---|
| MnDOT acknowledges historical injustices in transportation, where some communities were underserved and harmed by agency decisions. They recognize that past choices denied Black, Indigenous, and disabled communities full transportation benefits. | Transportation equity, as defined by MnDOT, seeks fairness and justice in the distribution of benefits and burdens within transportation systems, with a focus on empowering underserved communities, particularly Black, Indigenous, and People of Color, in decision-making processes. | MnDOT acknowledges that their journey toward transforming transportation systems and achieving equity requires ongoing listening, learning, adaptation, and implementation. |
MnDOT has facilitated a series of conversations between MnDOT staff and individuals and organizations that work with and represent underserved communities in Minnesota through the Community Conversation Project. The objective of these conversations is to directly learn from underserved communities about their unique experiences and challenges with transportation. Main findings include:
- Inadequate transportation options create barriers to the community.
- Private vehicles are common.
- Capacity of public transit does not meet demand.
- Land use and natural barriers also affect access.
- Relationships are key to engagement.
- People have many ideas to solve challenges with transportation equity.
- Organizations provided varied definitions and examples of equity.
These conversations have culminated in the creation of a report for each of the eight operational districts, which summarizes findings and provides recommendations for the future direction of transportation decisions. Additionally, MnDOT has initiated "The Equitable Contracting and Engagement" project to explore methods of enhancing the accessibility and inclusivity of MnDOT's contracting and engagement processes. MnDOT aims to collaborate with more community-based organizations and nonprofits and advance their engagement efforts. Furthermore, MnDOT has prioritized and sponsored research projects with an equity focus to enhance understanding and promote initiatives that embrace equity principles.
Note: This practice example was derived from the Minnesota Department of Transportation’s website. Further details on the “Advancing Transportation Equity Initiative” can be found here: https://dot.state.mn.us/planning/program/advancing-transportation-equity/
Read more in the chapter: 2.6.2 Integrating Equity in TAM PracticesCarver County, Minnesota
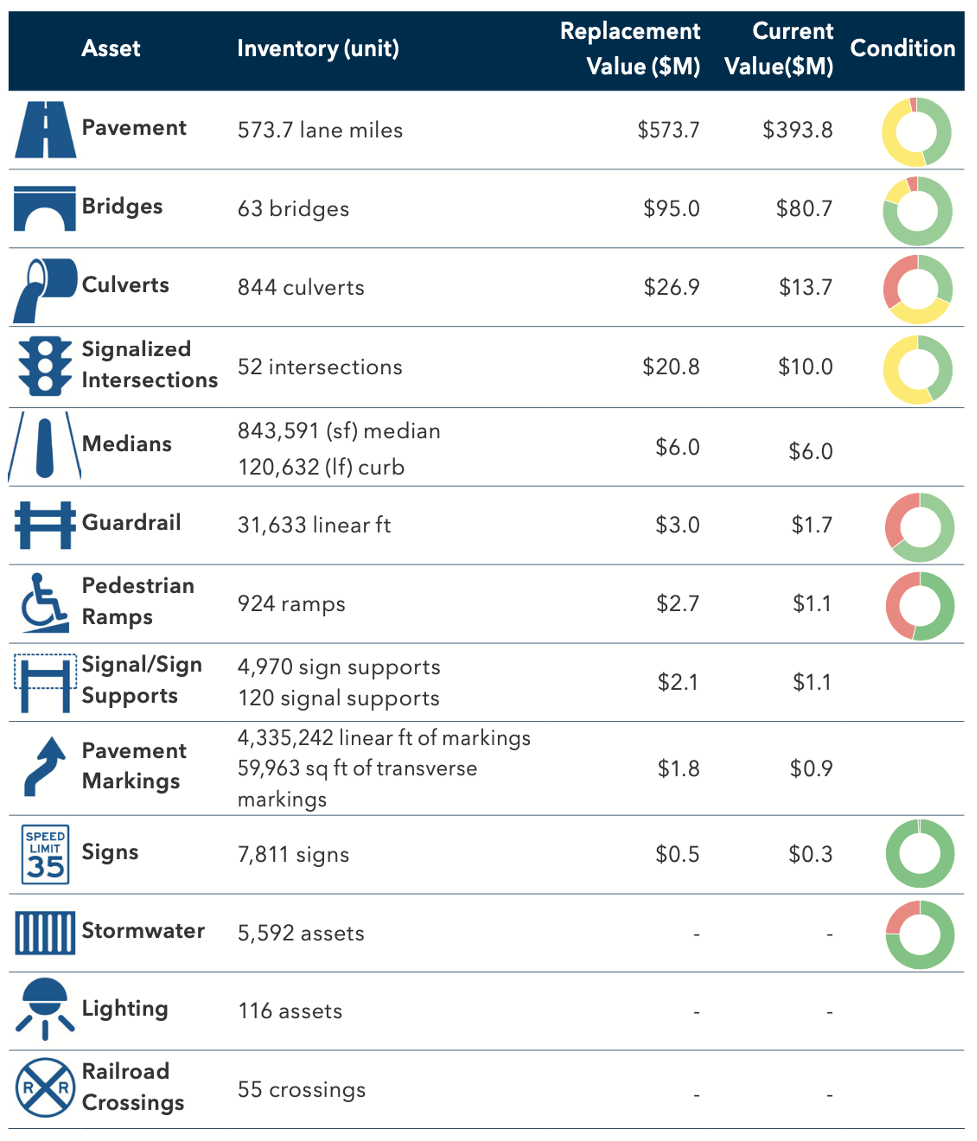
Carver County Public WorksCarver County, located in the Minneapolis-St. Paul metropolitan area, is responsible for managing a variety of transportation assets, including rural and urban roads, intersections, lighting, railroad crossings, and pedestrian crossings. Carver County Public Works captured these assets in a 2021 Transportation Asset Management Plan which uses asset value to communicate the scope and condition of the system.
For each asset, Carver County calculates a replacement value (unit costs * units) and a current value (replacement value – depreciation) using the cost perspective. Due to varying levels of resources and data available for each asset, there are multiple ways that depreciation is calculated, including age-based and condition-based approaches. Some assets use compliance with standards and guidelines (e.g. ADA) as a proxy for condition, which in turn is used to calculate depreciation.
The asset replacement and current values help communicate the state of the county’s asset inventory to the public and provide a financial account of the publicly owned assets.
Source: Carver County Public Works Division. Transportation Asset Management Plan: Carver County. Carver County Public Works Division, 2021.
Read more in the chapter: 5.5.2 Using Asset Value to Support TAM DecisionsImpact of Inflation on Road Construction Expenditures
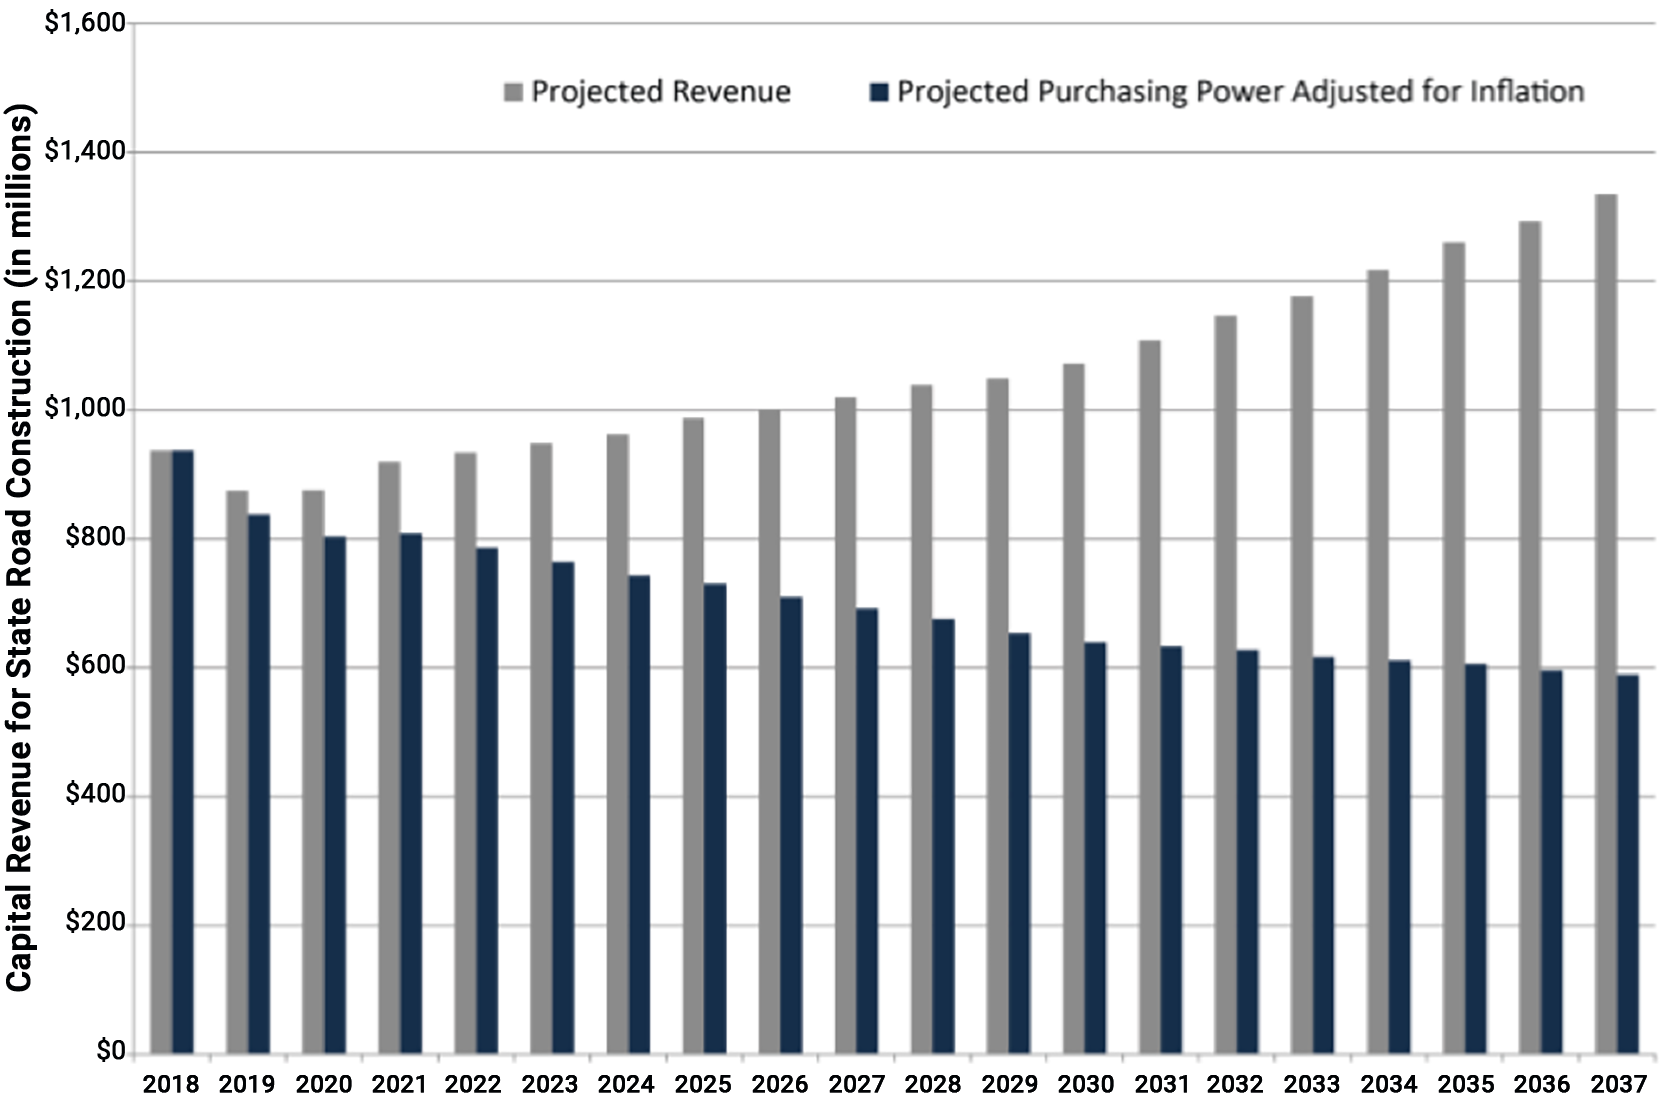
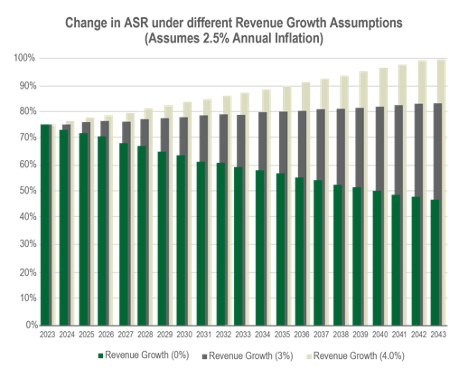
Minnesota DOTThe Minnesota State Highway Investment Plan (MnSHIP) outlines a 20-year strategy for investing in the state highway system. The most recent document, published in 2017, outlines investment priorities for the period from 2018 to 2037 (http://minnesotago.org/application/files/3414/8431/5979/ MnSHIP_Final_Jan2017.pdf). One of the figures included in the plan uses historical inflation trends to illustrate the declining purchasing power of revenue due to construction costs growing at an annual rate of approximately 4.5 percent. This cost growth rate exceeds the projected annual revenue growth rate of approximately 2 percent, which is expected to erode over half of the buying power of revenues by 2037. As a result of this analysis, MnDOT was able to communicate its financial situation with stakeholders and could better manage the risks associated with continued construction cost increases over the planning period.
Anticipated Construction Revenue by Year Including Adjustments for Inflation
Source: Minnesota DOT. 20-Year State Highway Investment Plan 2018-2037.
Read more in the chapter: 6.3.2 Using Trend Data to Make Program AdjustmentsRevenue Projection
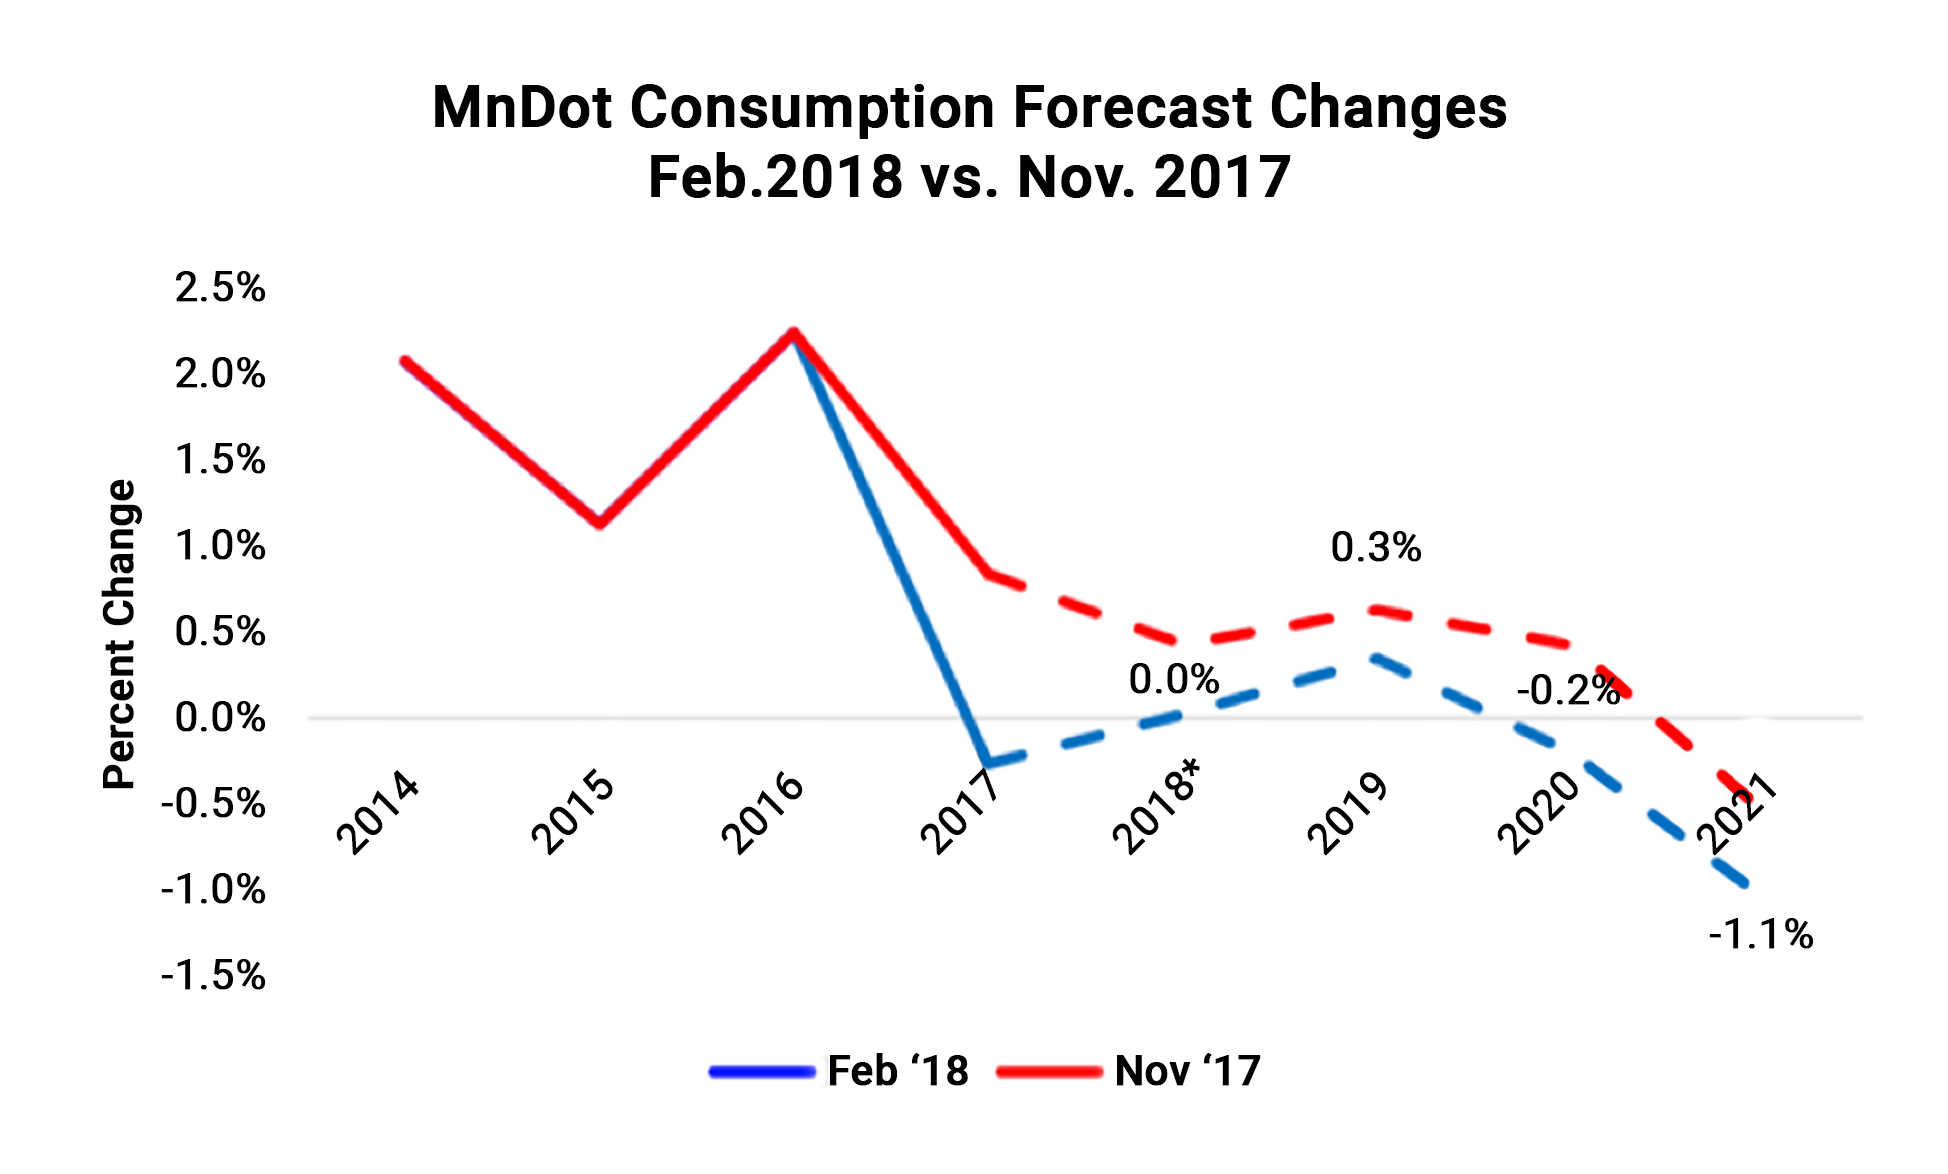
Minnesota DOTMnDOT forecasts future funding in its annual Transportation Funds Forecast. This document projects funding by source for a four-year period. The report includes the funding projection, as well as additional details supporting the projections. For instance, it details trends in key parameters that impact funding, such as fuel consumption and vehicle sales. For these and other parameters the report shows historic trends, prior projections, and revised projection. The graph below, reproduced from the 2018 report, shows data for historic and predicted fuel consumption. The report also documents reasons for any changes in the projections, and risks that may impact future revenue. MnDOT uses its revenue projections to support development of the STIP, as well as to inform the funding projections in other reports, such as the TAMP and LRTP.
MnDoT Consumption Forecast Changes
Source: MnDOT Transportation Fund Forecast. 2018. https://www.dot.state.mn.us/funding/documents/Transportation%20Forecast%20Feb%202018.pdf
Read more in the chapter: 5.3.2 Implications for Resource AllocationCulture Change
Minnesota DOTMnDOT has had a culture of innovation for a long time, and its TAM culture in particular has been advancing. The innovative nature of MnDOT has helped with TAM implementation, but the organization has struggled to fully embrace all of the elements of TAM. The need to institutionalize risk management is an important aspect of MnDOT’s TAM program and progress is being made incrementally. TAM leadership understands that change takes time and they are making progress using a continuous improvement approach.
Read more in the chapter: 3.3.1 TAM CultureCompetencies and People - Minnesota
Minnesota DOTThe TAM lead at MnDOT came to the role from the maintenance side of the agency. The experience and understanding of maintenance business processes, data needs, and organizational culture help him lead and manage the implementation of TAM processes. Having direct responsibility for budgets and workplans related to maintenance assets, as well as experience in setting statewide performance measures for maintenance services, provided valuable skills and knowledge that now help him to deliver the TAM program at MnDOT.
Read more in the chapter: 3.1.3 CompetenciesAligning Strategy with TAM Organization: Integrating All Planning
Minnesota DOTThe TAM unit at the Minnesota Department of Transportation (MnDOT) is located in the multimodal planning division. TAM is a key part of MnDOT’s integrated planning process, which utilizes a framework defined with explicit coordination across plans and programs.
Source: MNDOT TAMP 2019
Read more in the chapter: 3.1.1 Organizational Models
Performance Programming Process (Px3)
Montana DOTThe Montana Department of Transportation’s (MDT) Px3 process applies performance management principles to establish funding allocations across the agency’s five districts. The Px3 process provides a framework for optimizing funding and meeting short- and long-term goals. The process does not select projects. Instead it directs funding to areas of need based on the following core principles (MDT 2019):
- Performance Based - MDT allocates resources to support the most effective and efficient investments. Forecasted and actual outcomes are prepared to establish and update performance targets.
- Data-Informed - Data is collected annually and analyzed using computer-based management systems to optimize future investment levels.
- Customer Driven - Investments support long-term goals established through statewide planning, as described in TranPlanMT.
- Continuous Improvement - Management systems are adjusted and calibrated based on the latest data and trends. Processes are regularly reviewed and updated.
- Transparency and Accountability - Processes are documented to clearly explain how MDT allocates resources and tracks performance.
The Px3 process considers information from a number of planning inputs, including Montana’s long range plan (TranPlanMT), asset condition data, current programming, and the agency’s performance objectives, measures and targets. These inputs are used to determine the best allocation of funds to meet desired pavement and bridge conditions. That recommended funding is presented to the Montana Transportation Commission for approval and then combined with non-Px3 funds to develop MDT’s full program.
MDT’s 2022 TAMP indicates that the Px3 process and expected funding levels will allow the agency to achieve its desired state of good repair for NHS pavements and bridges by 2030. This performance improvement is in large part due to a continued focus on pavement preservation, an increase in funding for bridge replacement and rehabilitation, and expected distribution of funding through the Px3 process. The Px3 process is repeated every 18 months to update MDT’s capital program, as outlined in figure 1. (MDT 2019).
Source: Montana Department of Transportation (MDT). 2019. “Px3 Performance Programming Process.” MDT, Helena, MT.
Read more in the chapter:Tracking Maintenance Activities
Montana, Tennessee, and Utah DOTsSeveral state DOTs are employing the use of technology to track maintenance work activities as noted below.
When new assets are installed as part of a construction project for the Montana DOT, Construction personnel are required to provide Maintenance with the information needed for updating the asset inventory. Maintenance verifies the information provided by Construction before inputting it into the system.
The Tennessee DOT uses an automated data collection van to establish its asset inventory for approximately 20 assets. The inventory is entered into a maintenance management system at a summary level for each county and a “ghosting” technique is used to identify differences in the inventory from one year to the next year.
The Utah DOT extracts is asset inventory every two to three years from the LiDAR collected as part of the agency’s annual pavement condition surveys; however, the DOT is moving towards a continuous inventory updating process that would be the responsibility of Maintenance supervisors.
Read more in the chapter: 6.4.1 Importance of Tracking Work Activities and Treatment CostsAligning a TAMP to Broader Planning Initiatives
Montana DOTWhen developing their 2018 TAMP MDT aligned their pavement performance targets and goals to those within their planning document TranPlan 21 (now TranPlanMT). TranPlanMT defines MDT's policy direction for operating, preserving, and improving Montana’s transportation system over a 20-year period. It serves as the guiding document for MDT decisions, especially those related to investing Montana’s limited transportation funds. This type of alignment can help illustrate a link from policy objectives to investment strategies and resource allocation.
Sources:
https://www.tamptemplate.org/tamp/030_montanadt/
https://www.mdt.mt.gov/tranplan/
Read more in the chapter: 2.2.1 Planning and Programming
Evaluating the Effectiveness of Two Types of Friction Courses
North Carolina DOTThe North Carolina DOT conducted an analysis to determine the effectiveness of an open-graded friction course and a surface constructed with a FC-2 (friction course) gradation. Data from the pavement management database was used, including inventory data, construction information and pavement condition ratings. The performance data were plotted against the survey year for each pavement section where one of the two types of surface friction courses was applied. The results showed the performance of the open-graded friction course dropped at year 10, while the FC-2 graded surface dropped in performance at year 8. The study also found that all FC-2 sections had received another treatment by year 11. The results from the analysis were used to increase the use of open-graded friction courses across the state.
Read more in the chapter: 6.4.3 Using Work History Information to Improve ModelsPerformance Scorecard
North Carolina DOTThe North Carolina DOT has an interactive Organizational Performance Scorecard that provides an online indicator of the Department’s success at meeting targets in the following six core goal areas:
- Make Transportation Safer.
- Provide Great Customer Service.
- Deliver and Maintain Infrastructure Effectively and Efficiently.
- Improve Reliability and Connectivity of Transportation Systems.
- Promote Economic Growth Through Better Use of Infrastructure.
- Make NCDOT a Great Place to Work.
An example of how the information is shown; it presents the target for an overall infrastructure health index and the most recent results. As shown by the red “x” in the box on the far right, NCDOT is not currently meeting its target of a health index of 80 percent or more.
North Carolina DOT’s Organizational Performance Scorecard Website – Excerpt
Source: NCDOT. 2019.https://www.ncdot.gov/about-us/our-mission/Performance/Pages/default.aspx
Read more in the chapter: 6.1.1 Selecting and Using Performance MeasuresCross-Asset Resource Allocation
North Carolina DOTSince 2009, North Carolina DOT has used a structured approach to help prioritize capital investments across modes and asset classes. The initial version of the approach (Version 1.0) focused on prioritizing mobility and highway modernization projects supported by data on congestion, crashes and pavement condition. Over time the process evolved to include additional investment types and data. North Carolina’s Strategic Transportation Investments Law adopted in 2013 helped formalize the process, requiring that NCDOT allocate 40% of its available funds for mobility to Statewide Mobility projects that address congestion and bottlenecks, 30% of funds to projects with Regional Impact that improve connectivity within Regions, and 30% of funds to projects that address local needs. Different approaches are used for prioritizing investments in each mode (highways, aviation, bicycle-pedestrian, public transportation, ferry and rail) within each of these three groups. In Version 5.0 of the process, implemented in 2018, 24 different types of improvements are considered for highways. Candidate projects are scored in 10 areas, including pavement condition, considering a mix of existing conditions and predicted conditions as a result of the proposed project, as illustrated in the figure.
Highway Scoring - Eligible Criteria with P5.0 Measures
| Criteria | Measure | Existing Conditions | Project Benefits (Future Conditions) |
| Congestion | Volume/Capacity + Volume | ||
| Benefit/Cost | (Travel Time Savings + Safety Benefits)/Cost to NCDOT | ||
| Safety/Score | Critical Crash Rate, Density, Severity, Safety Benefits | ||
| Economic Competitiveness | % Change in Jobs + % Change in County Economy | ||
| Accessibility/Connectivity | County Economic Indicator, Improve Mobility | ||
| Freight | Truck Volume, Truck %, Future Interstate Completion | ||
| Multimodal | Multimodal Benefits | ||
| Lane Width | Existing Width vs. Standard Width | ||
| Shoulder Width | Existing Width vs. Standard Width | ||
| Pavement Score | Pavement Condition Rating |
Source: NCDOT. 2019. https://connect.ncdot.gov/projects/planning/MPORPODocuments/P5.0%20Master%20Presentation%20-%20July%202018.pdf
Read more in the chapter: 5.2.3 Use of Multi-Objective Decision Analysis for Resource Allocation
Performance Measure Evaluation
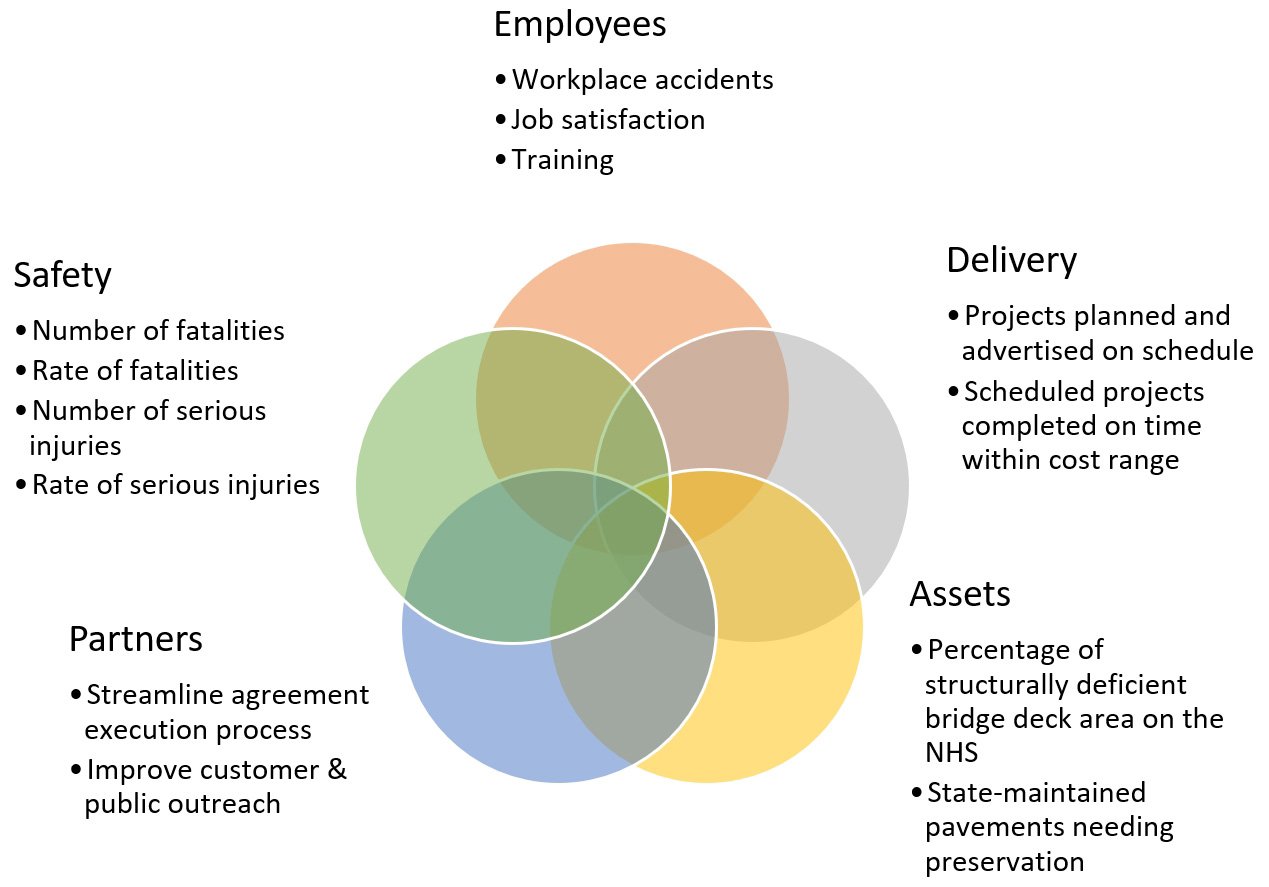
Nevada DOTThe Nevada DOT recognized that although performance measures were being reported regularly, they were not driving agency policies or decisions. The assessment evaluated the performance measures being used in each of the five key performance areas shown in the figure as well as the organizational culture to support performance management.
The study recommended improvements to emphasize the importance of messaging in order to advance the agency’s performance management culture, extend the performance culture beyond the headquarters office to field staff, and develop job performance plans emphasizing accountability at the division, office and unit levels. The study also recommended the periodic review of performance measures to ensure their continued relevance to agency business processes.
Nevada DOT’s five key performance areas and measures
Source: Nevada DOT. 2017. Adapting a Culture for Performance Management at the Nevada Department of Transportation.
Read more in the chapter: 6.1.2 Evaluating the Effectiveness of Performance MeasuresInterval-Based Approach to Managing ITS Assets
Nevada DOTNevada DOT recognized that the level of investment in ITS equipment (e.g., closed-circuit cameras, dynamic message signs, flow detectors, highway advisory radios, environmental sensor stations, and ramp meters) was increasing significantly and the importance of this equipment to network operations was growing. As a result, the DOT chose to establish a method of managing its ITS assets that would minimize the risk of failure and provide information to support budgeting activities. However, since the DOT had limited data on its ITS components, a process was developed that relied on the following factors to establish maintenance cycles:
- Historical performance
- The typical timeframe before the software became outdated
- Manufacturer recommended service life
- To determine the condition of ITS traffic cameras, Nevada DOT developed a transition probability matrix with four condition criteria based on the device manufacturers’ recommended service life as follows:
- Good – device age is less than 80 percent of the manufacturer’s recommended service life
- Low risk – device age is between 80 to 100 percent of the manufacturer’s recommended service life
- Medium risk – device age is between 100 to 125 percent of the manufacturer’s recommended service life
- High risk – device age is greater than 125 percent of the manufacturer’s recommended service life
The transition probability matrix was used to model ITS asset deterioration and program maintenance actions over a 10-year analysis period via the use of a simple spreadsheet tool. The results of this analysis showed an interval-based approach to managing ITS assets would result in an estimated savings of $1.1 million over a 20-year period.
Source: Nevada DOT TAMP (2018)
Read more in the chapter: 4.3.2 Applying Other Life Cycle Management ApproachesAsset Management Organizational Models - Maintenance and Operations Office
Nevada DOTAt the Nevada DOT, the Maintenance and Asset Management Division leads the development of the agency’s Transportation Asset Management Plan (TAMP). The division supports district activities to ensure that the state-maintained highway system is maintained in a condition consistent with the Nevada DOT TAMP, work plans, policies, program objectives, budget, and available resources. It also supports a proactive preservation focus in maintenance that extends to the 10-year investment strategies outlined in the TAMP.
Read more in the chapter: 3.1.1 Organizational Models
Correlation Between NJDOT Condition Status Rating and Federally-Mandated Condition Ratings
New Jersey DOTNCHRP Web-Only Document 358, which is a supplemental report to the Guide to Effective Methods for Setting Transportation Performance Targets, provides examples documenting how target-setting methods are being used by various transportation agencies. One of the examples illustrates how the New Jersey DOT piloted the use of a scenario analysis approach for setting its pavement infrastructure condition targets. An important consideration in the use of this approach was the availability of a pavement management system (PMS) capable of forecasting future pavement conditions. However, the New Jersey DOT had not established prediction models for the Federal cracking metric, so methods were developed to correlate forecasted conditions from existing models to the Federally-required cracking metric. Correlations were developed using three years of condition data collected in accordance with both the agency’s legacy Condition Status rating and the Federal measures in 0.1-mi segment lengths. Using both sets of data, correlations were developed based on the likelihood that a pavement section rated “Good” using the agency’s CS rating would also be classified as a “Good” pavement using the Federal definitions. The correlations found that 88.43 percent of the segments were rated “Good” based on both approaches (Grant, M., et.al. 2023B). A similar approach was used to correlate “Poor” conditions, but the analysis showed more variability in correlating segments at this condition level. To address the variability, New Jersey DOT decided to use 3-year averages to establish the final correlations, which are presented below (Grant, M., et.al. 2023B).
Table 6.A - Correlation between NJDOT CS and Federally-mandated condition ratings (Grant, M., et.al. 2023B)
| Federal Good | Federal Fair | Federal Poor | |
|---|---|---|---|
| NJDOT Good | 87.5% | 13.78% | 0.00% |
| NJDOT | 23.74% | 76.25% | 0.01% |
| NJDOT | 6.36% | 86.02% | 7.62% |
The correlations were applied to the predicted conditions generated by the PMS to determine the expected conditions using the Federally-mandated performance measures. Several scenarios were generated, allowing the NJDOT to use the results to set realistic Federal targets.
Read more in the chapter: 6.1.3 Target Setting MethodsDeveloping a TAM Steering Committee
New Jersey DOTThe New Jersey DOT TAM Steering Committee is comprised of NJDOT senior leadership. The committee sets policy direction and provides executive oversight for the performance management of the state highway system. The Transportation Asset Management Steering Committee provides general direction to the TAMP effort and assists in communicating the purpose and progress to other stakeholders.
Read more in the chapter: 3.2.1 Internal Coordination
NMDOT Project Evaluation Assessment
New Mexico DOTNew Mexico DOT (NMDOT) had recently implemented a new data-driven methodology to prioritize proposed capital projects. The agency wanted to use the TAM Data Assessment to identify data and information system improvements to advance and sustain District implementation of the new approach and prioritization outcomes.
*Note: This practice example was derived from NCHRP Final Research Implementation Report 08-115: Guidebook for Data and Information Systems for Transportation Asset Management. More TAM Data Assessment research implementation examples are available at: https://www.tamdataguide.com/research-implementation-examples/
Read more in the chapter: 7.1.5 TAM Data GuideUsing Condition Trends to Illustrate the Effectiveness of Past Investments
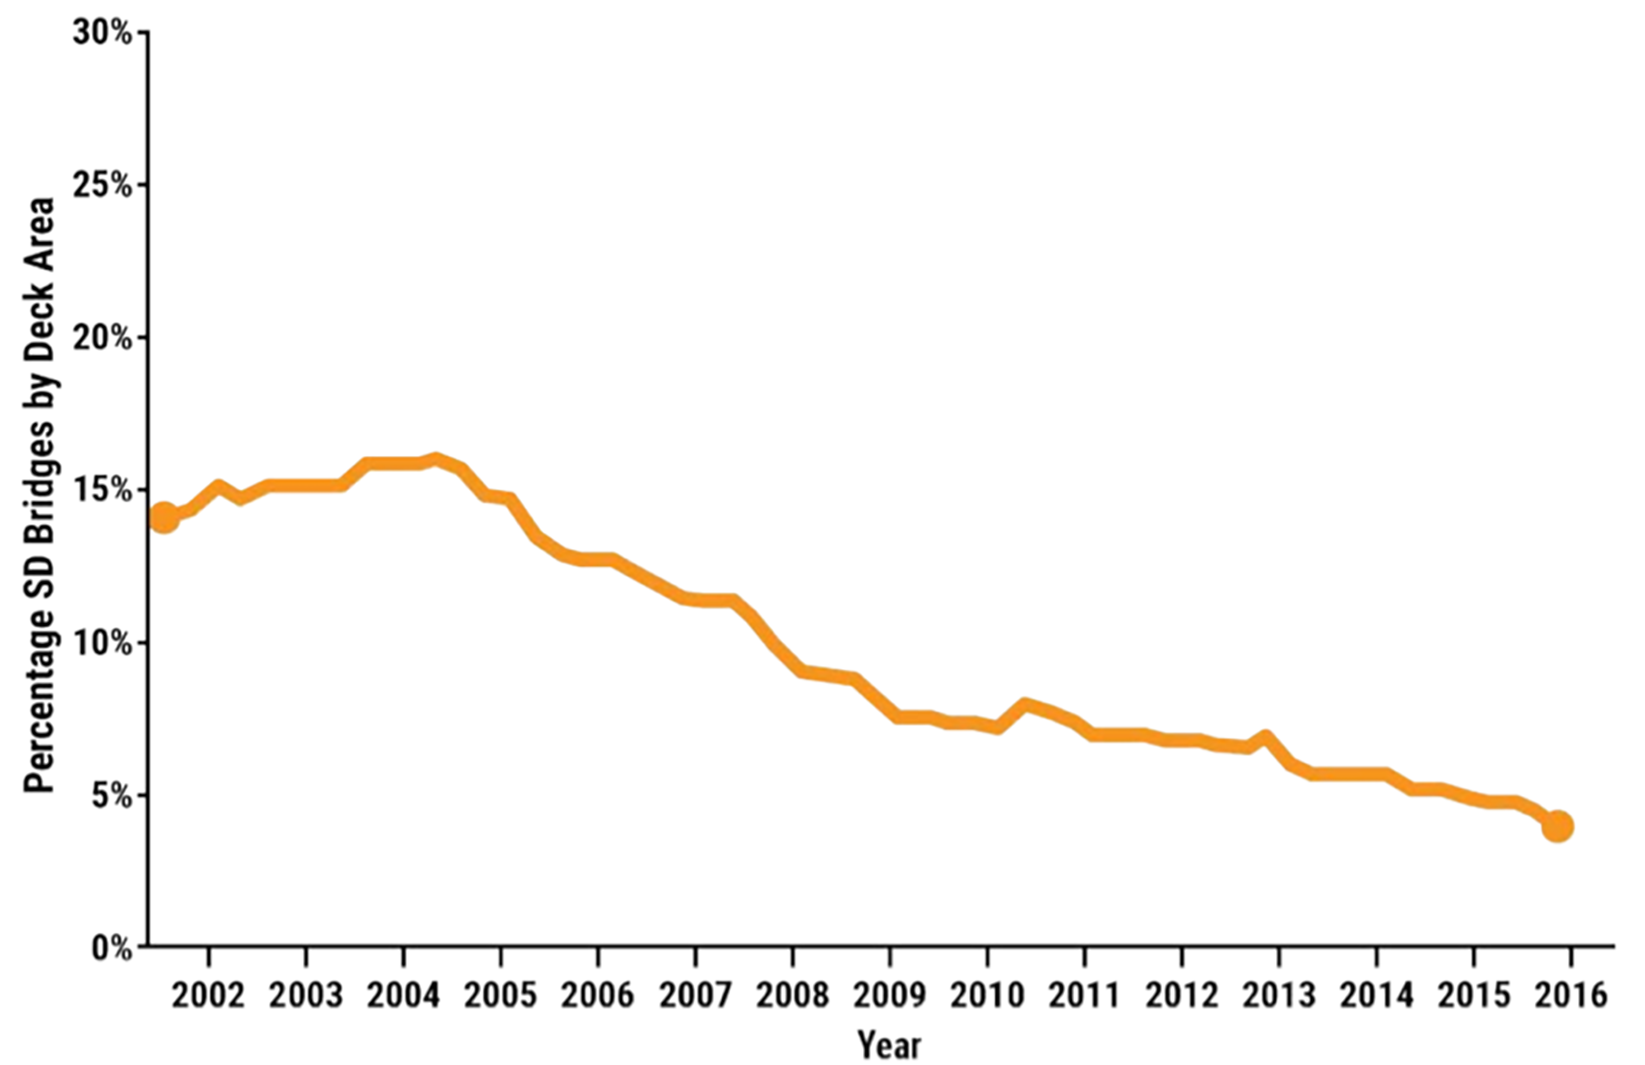
New Mexico DOTIn 2004, the New Mexico DOT realized that a significant percentage of state-maintained bridges were classified as structurally deficient. To address this issue, the agency targeted increased investments in bridge preservation. Going forward, the agency funded rehabilitation activities for bridges in poor condition and added preventive maintenance activities for bridges in good or fair condition to slow the rate of deterioration on these bridges. As shown in the figure to the right, the program has been very effective in improving bridge conditions. Adding a line to the graph showing the targeted conditions would help convey the impact that the increased preservation expenditures have had on achieving performance objectives.
Trend Showing the Decrease in Structurally Deficient Bridge Deck Area Resulting from Targeted Investments
Source: New Mexico DOT Transportation Asset Management Plan. 2018.
Read more in the chapter: 6.3.2 Using Trend Data to Make Program AdjustmentsCompetencies and People - New Mexico
New Mexico DOTThe Capital Program and Investment Director led the NMDOT Asset Management effort and has spent her career in transportation, starting at the FHWA before moving to NMDOT. She has worked in various parts of the NMDOT organization in engineering, administration, and as a district engineer. This variety of experiences gives her the competencies needed to be a successful TAM lead.
Read more in the chapter: 3.1.3 Competencies
Using Root Cause Analysis and Improving Asset Performance
New York State DOTIn 1994, New York State DOT (NYSDOT) determined that it needed to modernize its bridge designs to have longer service lives to help reduce future rehabilitation and replacement costs. Prior to this effort, the agency designed bridge decks to for a 50-year service life with a planned rehabilitation at year 35. The goal for this effort was to double the bridge deck design life to 100 years with a planned rehabilitation at year 75. The NYSDOT Materials Bureau investigated the major causes of bridge deck deterioration and determined that the primary cause of failure was corrosion of the reinforcing steel due the intrusion of chlorides from winter maintenance activities. Upon further investigation, it was determined that the chlorides were penetrating the bridge decks both through cracks and the natural porosity of the concrete. As a result of this research, the agency began a research and development effort to design a new standard concrete mix design that had lower permeability, higher resistance to cracking, and was pumpable to support standard bridge deck construction practices.
The result of the Materials Bureau’s effort became NYSDOT’s “Class HP” concrete, which utilizes fly ash (a byproduct of electric power production) and micro silica (a byproduct of electric arc furnaces used in manufacturing) to replace some of the Portland cement in its standard bridge deck concrete. These new materials are finer in size than cement particles, resulting in well graded denser packing of particles in the concrete, which reduces permeability. Class HP also creates less heat while it cures (or hardens), which reduces the occurrence of thermal shrinkage cracks when the deck cools. In 1997, Class HP became NYSDOT’s standard concrete mix for bridge decks. By using a failure mode analysis to identify the primary causes for bridge deck deterioration, NYSDOT could use new materials technology to address those causes and significantly lengthen the design life of its bridge decks.
Read more in the chapter: 4.1.3 Developing Life Cycle StrategiesTAM-Related Teams
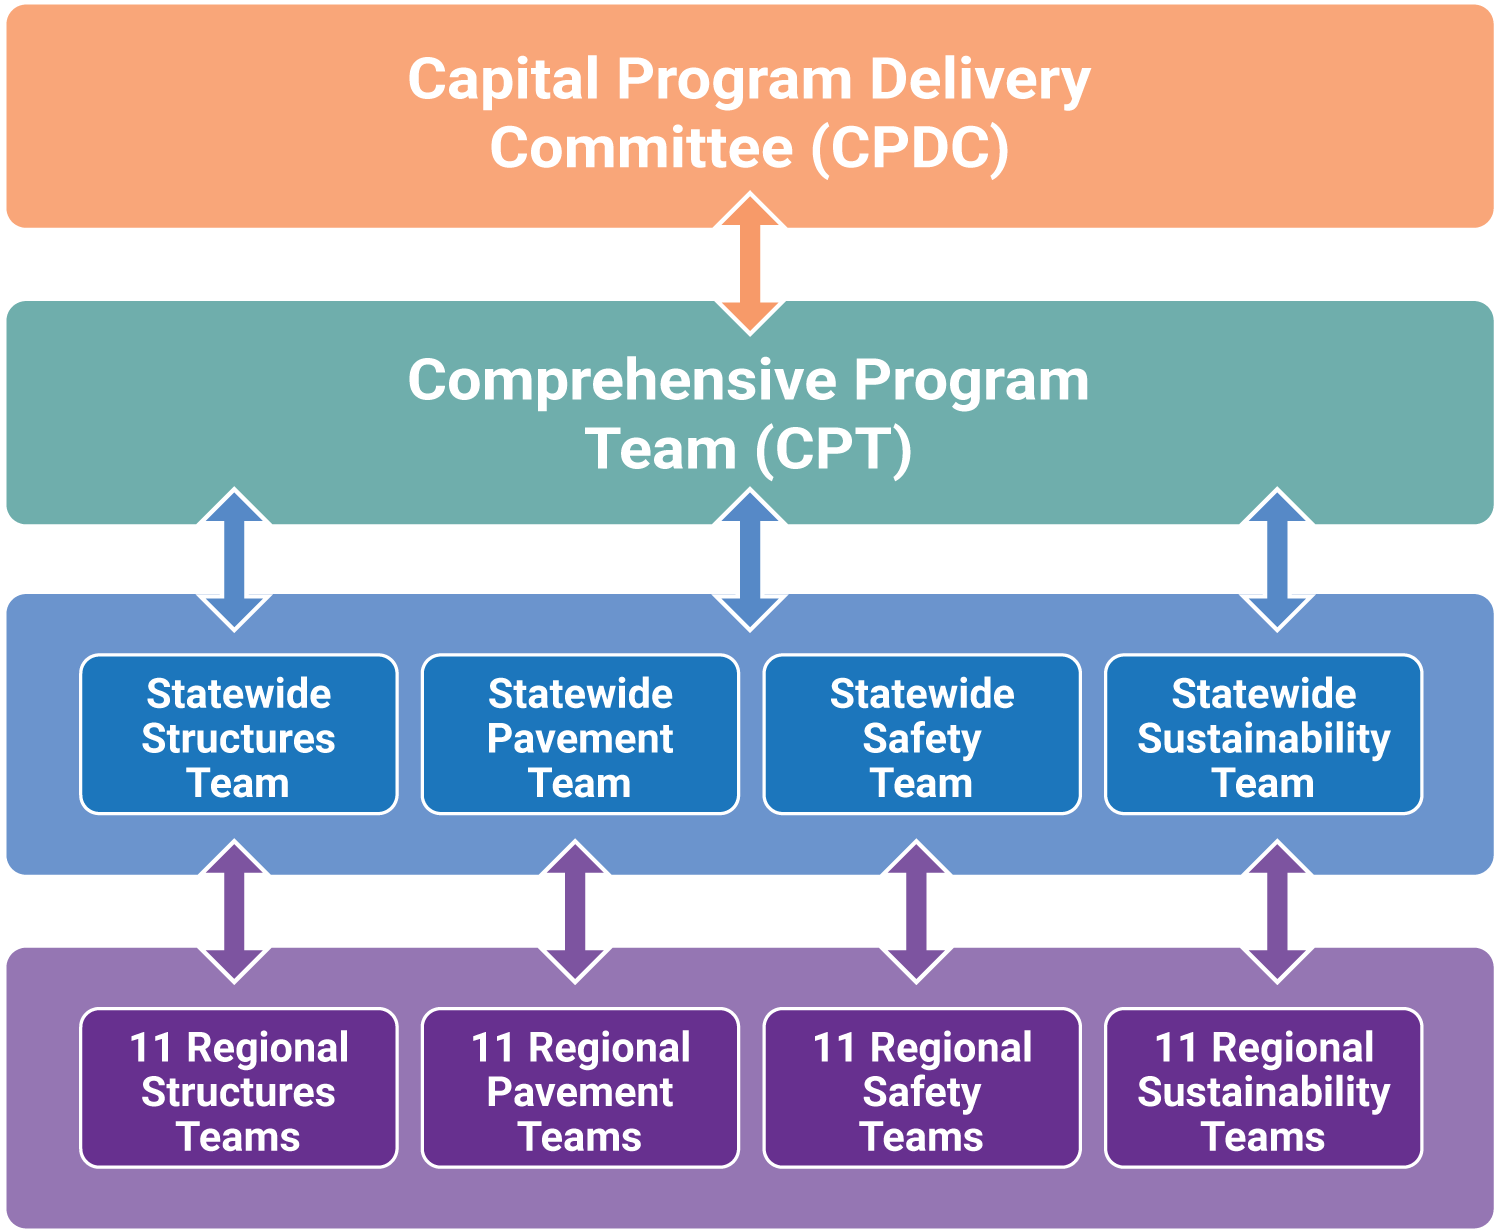
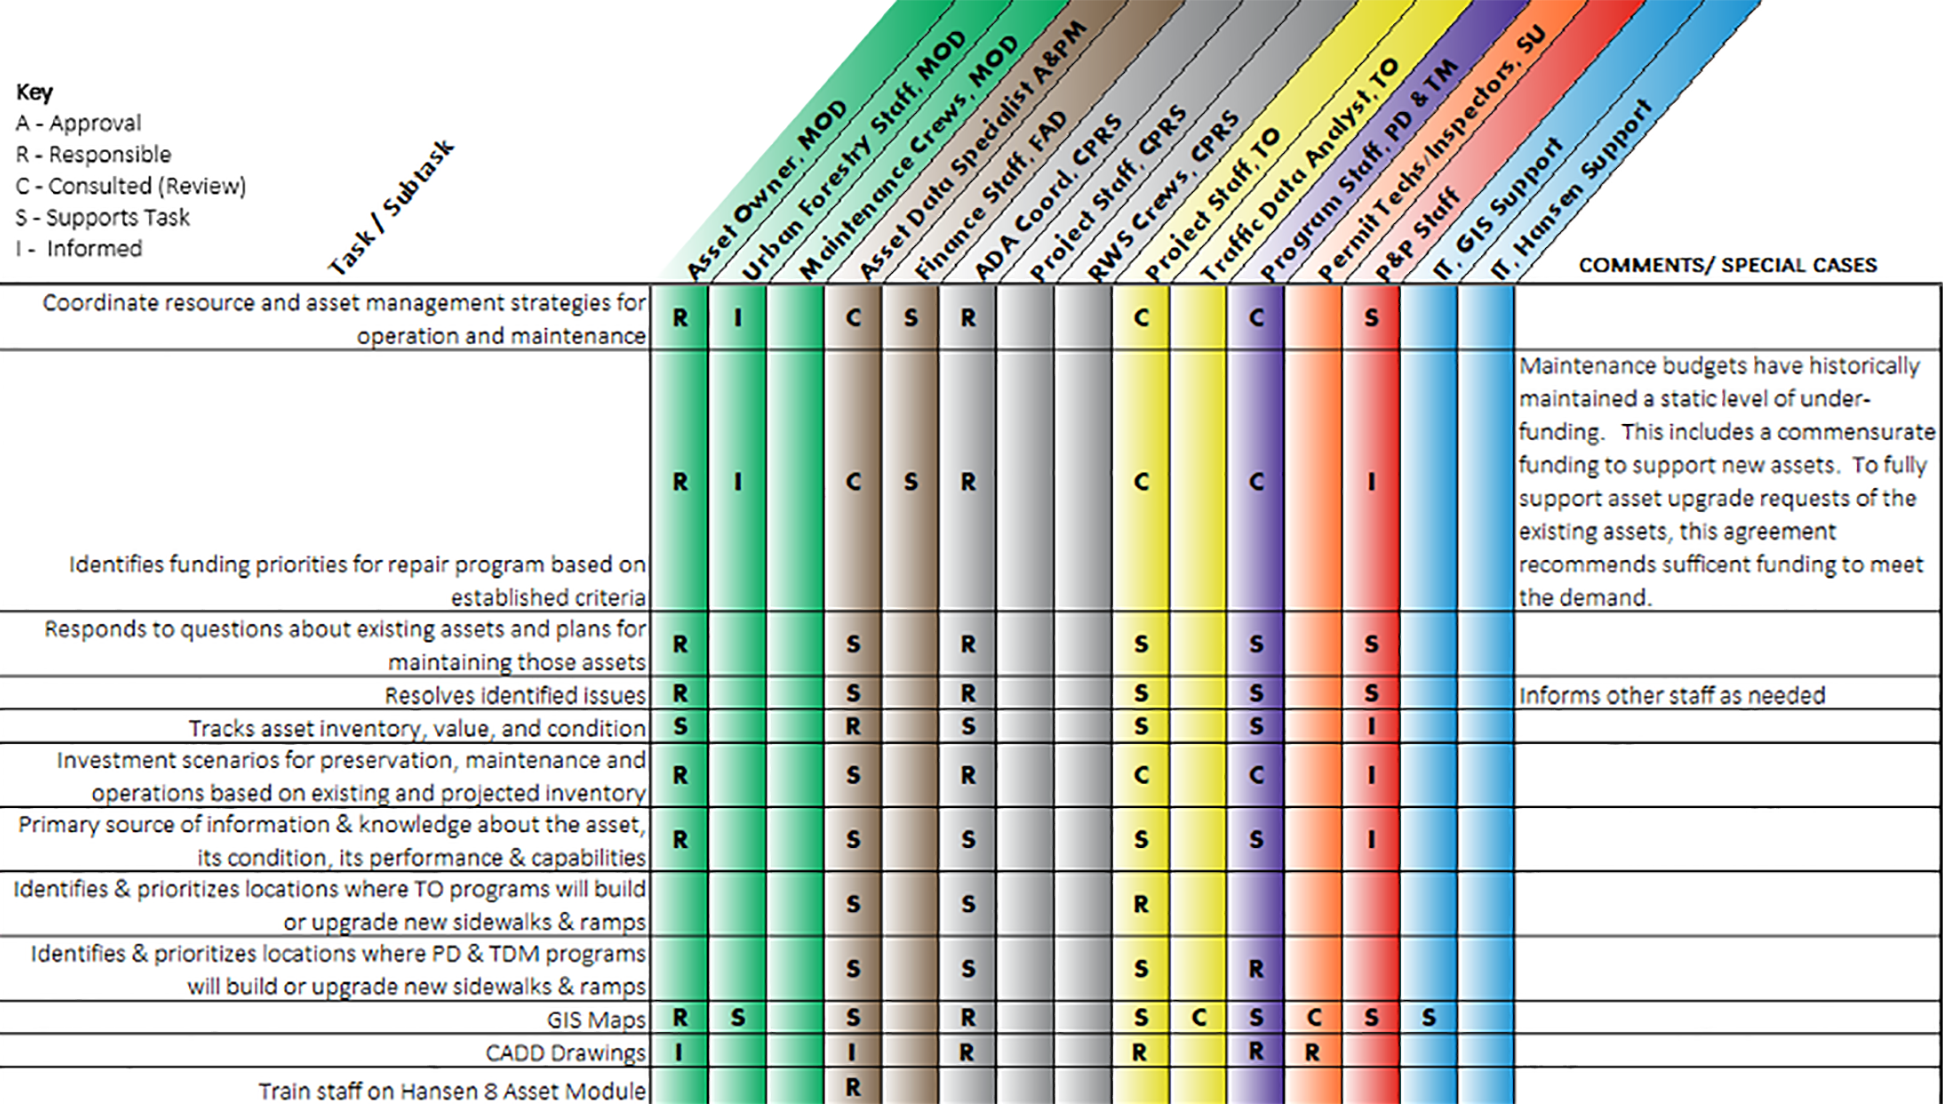
New York State DOTNYSDOT‘s TAM program is made up of a set of teams that perform TAM-related activities. They use TAM as an all encompassing set of principles that are embedded in activities they perform to make and deliver investments that provide mobility and safety to the traveling public. The TAM program coordinates inside the agency to ensure that TAM is being implemented as efficiently and effectively as possible. The following diagram illustrates the inter-relationships and communication that occurs across functional and geographic teams to make TAM work.
Source: Adapted from New York State Transportation Asset Management Plan. 2018.
Read more in the chapter: 3.2.1 Internal CoordinationDecentralized Central Office Role
New York State DOTAt NYSDOT, Asset Management is coordinated under the Director of Maintenance Program Planning who reports to the Assistant Commissioner for Operations and Asset Management. NYSDOT uses a committee structure, described in their TAMP, to define TAM roles and responsibilities. It has three tiers of related teams: first are the field teams who take action on assets; the next tier are statewide teams located in headquarters that provide a statewide functional team, and the top tier is a comprehensive program team that provides policy and monitoring. A diagram of this is provided in section 3.2.1.
Read more in the chapter: 3.1.1 Organizational Models
Process for Adding New Asset Data
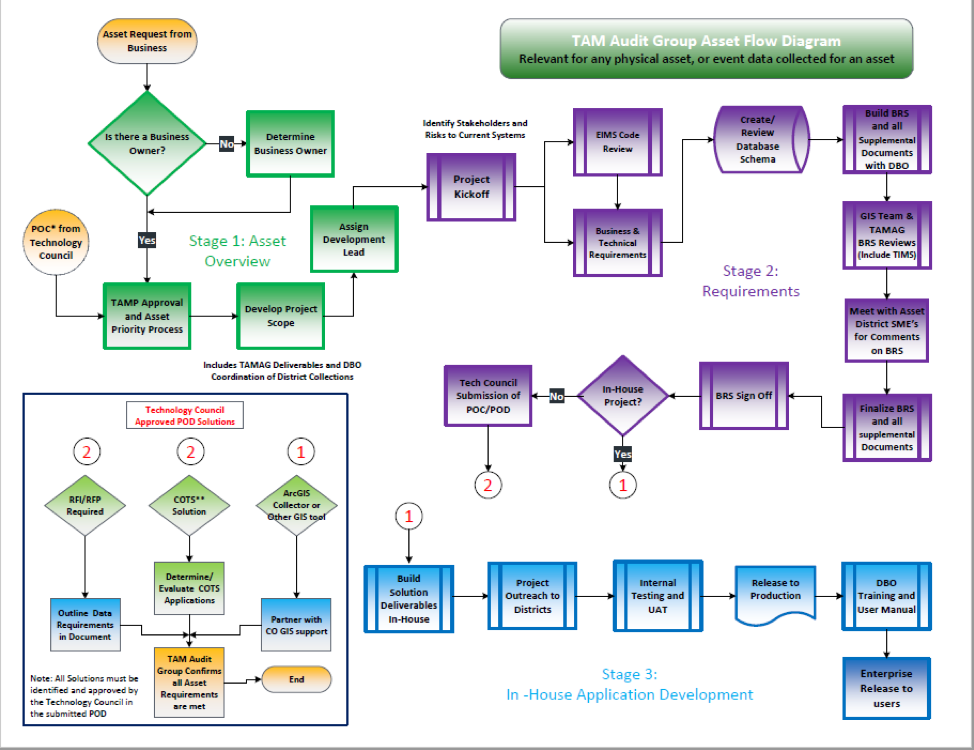
Ohio DOTOhio DOT has established a standard process for adding a new asset to their inventory. As illustrated in the flowchart below, the process has three stages – (1) Asset Overview, where the request is submitted, evaluated, and approved, (2) Requirements, in which business and technical requirements for collecting and managing the new data are documented, and (3) Application Development, where the technology solution is developed either in-house (using standard tools), via contract (for custom development) or through acquisition of a commercial off-the-shelf (COTS) package.
As part of the TAM Audit Group workflow shown in the figure, ODOT has introduced over 693,000 active ancillary assets into their inventory.
Ohio DOT TAM Audit Group Workflow Diagram
Source: Ohio DOT. 2019
Read more in the chapter: 7.4.2 Data Governance Practices Supporting TAMDefinition of Data-Driven Decision Making
Ohio DOTData-driven decision making can be defined as:
“An approach to business governance or operations which values decisions supported with verifiable data. The success of the data-driven approach is reliant upon the quality of the data gathered and the effectiveness of its analysis and interpretation”
Read more in the chapter: 7.3.3 Preparing Data for Sharing, Reporting and VisualizationIntegrating Asset and Project Information
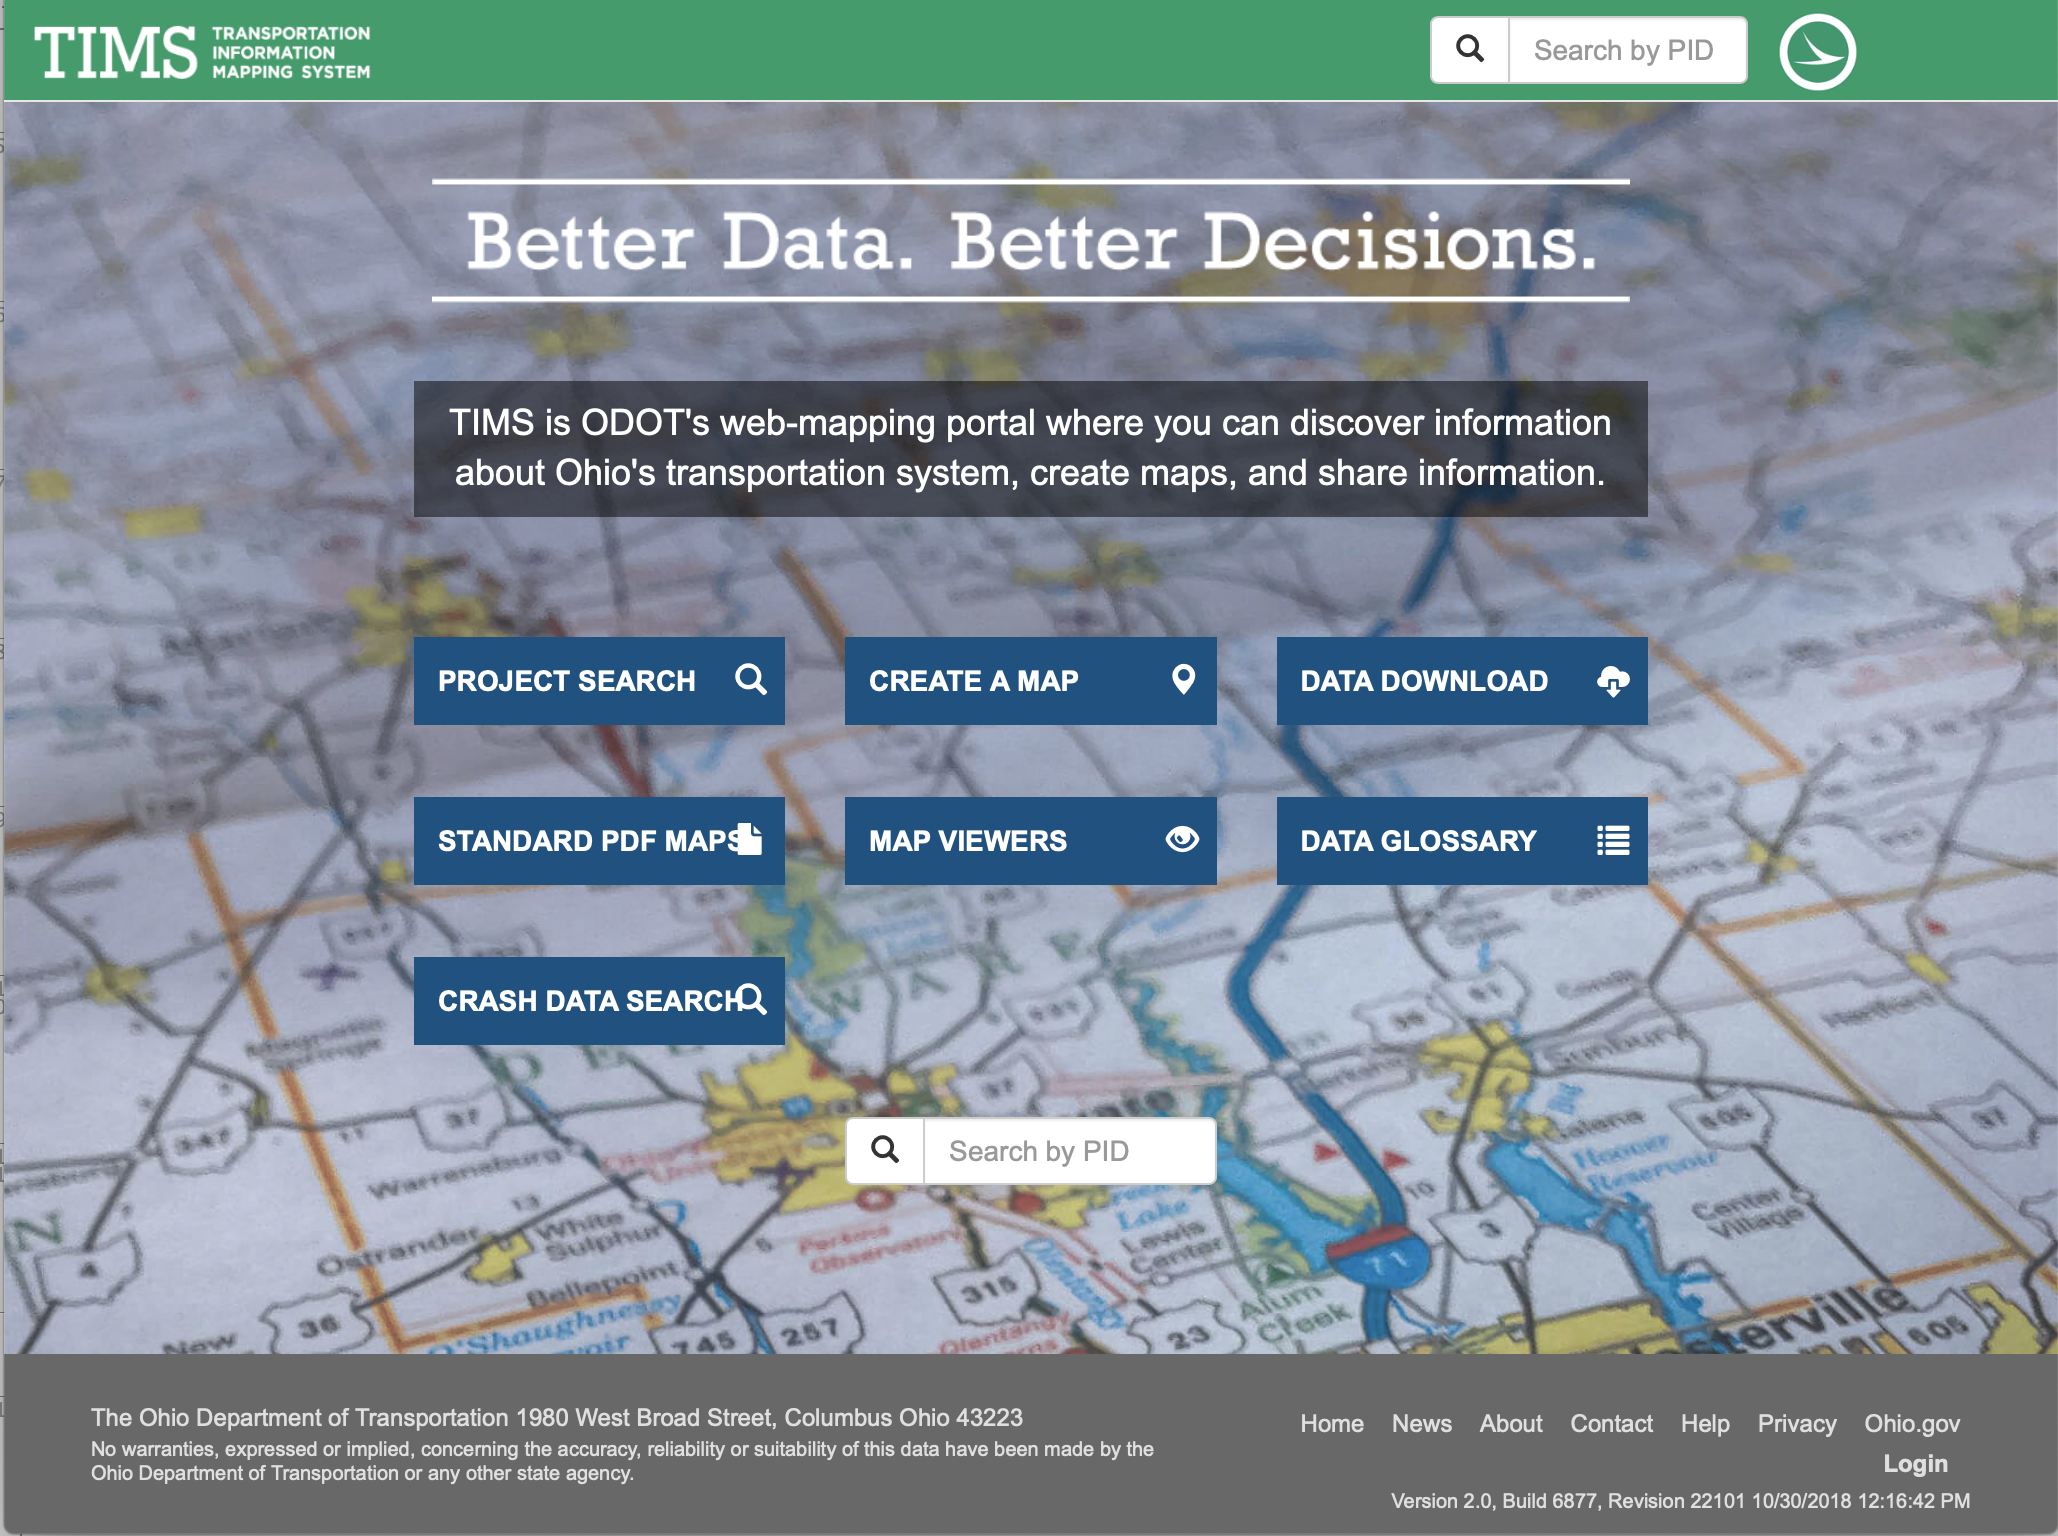
Ohio DOTOhio DOT has separate pavement and structures management systems, but integrates both asset and project information within its Transportation Information Management System (TIMS). A separate Transportation Asset Management Decision Support Tool (TAM-DST) allows for a user to combine data from TIMS with other state-maintained data sets to perform analysis and reporting. The application allows for one to consume large quantities of data in a timely manner to help make better choices in planning. See practice examples in Section 2.2.4 and Section 6.2.1 for more information on TIMS.
Read more in the chapter: 7.1.2 Why Integrate?Asset Condition and Performance Information Mapping System
Ohio DOTThe Ohio DOT recognizes the importance of integrated management systems to support both life cycle and comprehensive work planning activities. One of the tools developed by the Ohio DOT is its Transportation Information Mapping System (TIMS), which enables planners, engineers and executives to access and manage key asset, safety and operational data in an integrated web-mapping portal (https://gis.dot.state.oh.us/tims). The portal is available to both internal and external stakeholders and allows users to access information about the transportation system, create maps or share information. The data integration efforts enabling TIMS are now underpinning all management system implementations.
Read more in the chapter: 6.2.1 Types of Performance-Based Data to MonitorUse of a Pavement Management System to Establish a Life Cycle Strategies
Ohio DOTAs required under MAP-21, Ohio DOT conducted a risk assessment to identify the most significant threats and opportunities to its pavements and bridges. The analysis revealed that anticipated flat revenues, combined with the annual increases in cost to pave roads and replace bridges, would lead to significant reduction in conditions without changes to existing practice. The potential deterioration in pavement and bridge conditions were expected to significantly increase future investment needs due to the increase in substantial repairs that would be required.
Following the risk assessment, a life cycle analysis was conducted. The analysis found that by focusing on the increased use of chip seals and other preventive maintenance treatments on portions of the pavement network, the annual cost of maintaining the network could be reduced. A life cycle analysis for bridges showed similar results. The bridge analysis found that with just 5 percent of the NHS bridges receiving a preservation treatment annually, the DOT could reallocate $50 million each year to other priorities. The investment strategies outlined in the TAMP and the changes made to the DOT’s existing business processes enabled the agency to offset the potential negative impact of the anticipated flattened revenue projections.
The differences in the adopted life cycle strategies are compared to the past strategies in the Figure. Although the total number of treatments applied over the analysis period increases, the annual life cycle cost decreases because of the reduction in the number of rehabilitation strategies needed.
Ohio DOT’s Pavement Preservation Strategy Comparisons
Source: Ohio DOT Transportation Asset Management Plan. 2018. http://www.dot.state.oh.us/AssetManagement/Documents/ODOT_TAMP.pdf
Read more in the chapter: 4.3.1 Managing Assets Using Condition Based ManagementTransportation Information Mapping System (TIMS)
Ohio DOTOhio DOT (ODOT) has focused on data and information management improvements as a foundational element of their asset management program. As part of this they have strengthened their geographic information system (GIS) and linked it to over 80 data sets. The agency’s TIMS allows users to make collaborative decisions based on shared access to the same data sets.
Source: Ohio DOT. TIMS.https://gis.dot.state.oh.us/tims/
Read more in the chapter: 2.2.4 Information ManagementChange Management Due to System Change
Ohio DOTIn fiscal year 2016, ODOT began phasing in new requirements for the development of District Work Plans that combined Capital and Maintenance projects. At that time, Districts’ Work Plans were required to match 25 percent of the lower cost treatments (such as chip seals and micro-surfacing) recommended by the pavement management system. For FY2017 and beyond, District Work Plans are required to match 75 percent of these PMS recommendations.
This change was met with concern by some district staff in regards to data quality in the PMS, and lack of familiarity with the new process. To address staff concerns, the Asset Management Leadership Team conducted workshops, bringing in staff involved in pavement programming from across the state. The workshop focused on actions that Ohio DOT could take to improve the PMS and its programming processes.
Read more in the chapter: 3.3.3 TAM Change ReadinessVideo and Media
Ohio DOTTaking Care of What We Have: A message that defines the benefits that TAM brings through tangible examples that are linked to the DOT objectives. Ultimately this inspires confidence in the approach and the TAM decisions being made.
Video: https://youtu.be/B6jZJQBvpc0
Read more in the chapter: 3.2.3 CommunicationTAM Data Collection
Ohio DOTThe Ohio DOT Asset Management Leadership Team is a cross-disciplined team, with representatives from all major business units, that establishes data governance and data collection standards. A sub-group of the Leadership Team, the TAM Audit Group, is then responsible for overseeing all asset data related requirements, and making sure standards are in place and processes are followed. This group reviews and approves all data collection efforts and ensures that efforts are coordinated across the DOT. Having designated roles and responsibilities in regards to data governance and collection allows the agency to identify all potential customers of the data being collected and ensure that the data is sufficient to meet all relevant asset management needs.
The Ohio DOT deploys a hierarchy for managing TAM data collection.
- TAM data priority is established by the Governance Board (Assistant Directors)
- The Asset Management Leadership Team (AMLT), which is a cross-discipline team of representatives from all major business units, develop strategies and collaboration opportunities to achieve Governance Board directives
- The TAM Audit Group (TAMAG) perform business relationship management by working with data business owners, SMEs, and stakeholders to create enterprise TAM data requirements
- The Central Office GIS team utilizes the completed TAMAG business requirements to create data collection solutions
- The District TAM Coordinators provide oversight, support and coordination for data collection solution implementation, operations and performance
TAM Objectives
Oklahoma DOTThe Oklahoma DOT identified the following TAM objectives to help guide their asset management program:
- Maintain (improve) the condition of the state’s bridges and roadways
- Reduce risk associated with asset performance
- Make better data driven decisions about assets
- Reduce costs and improve efficiency, including effectively delivering projects that support asset management
- Increase internal and external communications and transparency
- Improve customer service
- Improve safety on the state’s transportation system
- Enhance mobility of people and goods
Decentralized TAM Implementation
Oklahoma DOTThe TAM unit at ODOT is in the central office under the planning unit but the implementation of TAM resides in ODOT’s field units called divisions. Most decisions on asset investments and actions occur at the division-level. The central office provides data and guidance to divisions, but decision-making on assets occurs within each division. With the MAP-21/FAST requirements and the need to deliver on the two and four year pavement and bridge targets, ODOT is considering ways to strengthen the central office and division coordination.
Read more in the chapter: 3.1.1 Organizational Models
Data Collection Tiers
Oregon DOT- Tier 1: Assets with high replacement values and substantial potential cost savings from life cycle management (e.g. pavements and bridges)
- Tier 2: Assets that must be inventoried and assessed to meet legal obligations (e.g. ADA ramps, stormwater management features)
- Tier 3: Assets with high to moderate likelihood and consequences of failure (e.g. traffic signals, unstable slopes, high mast lighting, sign structures)
- Tier 4: Other assets that would benefit from a managed approach to budgeting and work planning (e.g roadside signs, pipes and drains)
Evaluation of Performance Measures
Pennsylvania DOTAfter using performance measures for years, the Pennsylvania DOT recognized that the number of measures being used had increased to a level that was difficult to manage. In 2011, the Pennsylvania DOT conducted an assessment of their performance measures using the following series of questions to guide their decisions as to which measures to keep, which to change, or which to delete:
- Who is using the measure?
- What exactly is being measured?
- Why is this particular measure needed?
- Whose performance is being measured?
- Is the performance goal defined?
- Does a similar measure already exist?
- Is the existing measure meeting the needs and intent or should it be modified?
If a measure was needed where no measure exists, the following additional questions were used:
- Does the measure affect continuous improvement?
- Is the data for the measure updated as frequently as needed? Should it be updated monthly, quarterly, or yearly?
- Is the measure easy to quantify?
- Is the measure easy to understand?
- Is it clear who owns the measure?
- Does the measure provide a means of comparison?
- Have unintended consequences been investigated?
- Can the unintended consequences be successfully mitigated?
The process has helped to ensure that the agency is focused on the right measures to drive desired results and behaviors. The analysis found several issues that could be addressed, including eliminating duplicate or overly complicated measures, modifying measures that were driving unintended consequences, and resolving data quality issues.
Read more in the chapter: 6.1.2 Evaluating the Effectiveness of Performance Measures
Improving South Dakota DOT’s Pavement Deterioration Models
South Dakota DOTIn 2011, the South Dakota DOT initiated a project to revise the pavement deterioration models developed in 1997 using 17 years of historical pavement condition data. The tool for developing the models included features allowing all the condition-versus-age data points for each pavement meeting the family description (based on surface type and pavement structure) to be plotted on a graph, facilitating a comparison of the historical model and the recommended model based on the updated pavement condition information. In this example, the blue line (labeled as the user-defined model) represents the model being used in the pavement management system for predicting faulting on a thick, short-jointed doweled concrete pavement and the gold line (labeled as the regression equation). The regression analysis on the historical data, represented by the red data points, indicates faulting is occurring at a much more accelerated rate than was previously predicted. As a result, recommendations for addressing faulting were likely lagging the actual need observed in the field.
Illustration Showing How Historical Data can be Used to Modify a Deterioration Model
Source: South Dakota DOT. 2012. Technical Memo/Software Documentation
Read more in the chapter: 6.4.3 Using Work History Information to Improve ModelsUsing Historical and Projected Conditions to Evaluate Performance Targets
South Dakota DOTTo determine the effectiveness of road investments, the South Dakota DOT uses historical trends and projects conditions for each road category to show whether targeted conditions can be achieved with planned investment scenarios. The figure to the right illustrates the type of graph developed for the Interstate network. As shown, the graph presents both historical and projected conditions based on a Surface Condition Index (SCI) that ranges from 0 to 5, with 5 representing a distress free pavement. Overlaid on the graph is the acceptable condition range, which in this case spans an SCI between 3.8 and 4.2. The graph shows that Interstate conditions gradually improved over time. Although it projects average future conditions to drop, they are expected to continue to fall into the acceptable condition range. The results of the analysis provide the agency with confidence that the planned investments will achieve the desired condition levels over the analysis period. In addition, the projections are updated annually to provide a picture of changing financial trends and funding availability. This allows the DOT to react to any downturn in the projections.
Past and Future Pavement Conditions and Goals
Source: South Dakota DOT Transportation Asset Management Plan. 2019. https://dot.sd.gov/media/documents/SDDOT2019TAMPFHWASubmittalrevised8-28-2019.pdf
Read more in the chapter: 6.3.2 Using Trend Data to Make Program AdjustmentsSouth Dakota's Resource Allocation Process
South Dakota DOTSDDOT’s agency mission is “to efficiently provide a safe and effective public transportation system.” To support this high-level goal the agency sets ten-year objectives for its pavements and bridges, as well as a minimum acceptable condition for pavements. For pavements SDDOT summarizes conditions using Surface Condition Index (SCI), a composite measure represented on a scale from 0 (worst condition) to 5 (best conditions) that incorporates measures of roughness, rutting, faulting and distress indices. For bridges, SDDOT summarizes conditions based on the percentage of structures in good or fair condition, using the FHWA good/fair/poor measure for classifying the condition of a bridge.
To determine how to allocate capital funds for state-owned pavements and bridges SDDOT relies heavily on its pavement and bridge management systems. The agency predicts conditions for a 10-year period for a range of different budget levels, and then compares the predicted performance to the agency’s goals and objectives. The figures, reproduced from SDDOT’s 2018 TAMP, show results in terms of predicted SCI over time for five budget scenarios generated using SDDOT’s Pavement Management System (PMS), and results in terms of percent of bridges in good or fair condition for two budget scenarios generated using the agency’s Bridge Management System (BMS).
Given the projections as well as additional projections of pavement condition for six functional systems, the agency uses its Trade-Off Tool to evaluate the impact of different funding scenarios and recommends the funding distribution that will produce the greatest benefit. The final result of the analysis is a distribution of funding between asset type and functional system, as well as the distribution of funds between four types of work:
- Construction and Reconstruction
- Resurfacing and Asphalt Surface Treatment
- Rehabilitation and
- Safety
Decisions about what capital projects to perform are then made given the funding level established in the trade-off analysis.
Source: SDDOT Transportation Asset Management Plan. 2018.http://www.sddot.com/resources/reports/SDDOT2018TAMPFHWASubmittal.pdf
State Network Investment Strategies
State Network Structure Investment Strategies
Read more in the chapter: 5.1.3 Prototypical Resource Allocation ProcessUse of Incremental Benefit Cost to Demonstrate Long-Term Benefits
South Dakota DOTTo analyze the benefits of potential actions at the network level, South Dakota DOT (SDDOT) uses incremental benefit cost (IBC) analysis and deterioration models to determine the combination of feasible reconstruction, rehabilitation, and preventative maintenance treatments and timing at the network level that will give the best overall pavement and bridge conditions at the lowest practicable life cycle cost.
IBC analysis is used to answer a series of two important questions regarding pavement section treatments: Should the section be improved now, and if so, what is the best improvement to make? SDDOT’s IBC analysis process answers this set of questions by determining the combination of feasible reconstruction, rehabilitation and preventative maintenance treatments and timings that will use the anticipated state funds to yield the optimal overall asset conditions on the state highway network over a 20-year analysis period and the best long-term value to the system users (SDDOT TAMP, 2018).
Source: http://www.sddot.com/resources/reports/SDDOT2018TAMPFHWASubmittal.pdf
Read more in the chapter: 4.1.3 Developing Life Cycle Strategies
Use of LIDAR For Roadway Asset Inventory
Tennessee DOTThe Tennessee DOT uses an automated data collection van to collect pavement condition surveys each year in support of its pavement management system. In addition to the pavement sensors, the van also has high definition cameras and LIDAR sensors which scan the roadway and create a 3D model of the environment. As the surveys are conducted, inventory information for approximately 20 highway assets is extracted from photolog and LiDAR information. The inventory from the past data collection cycle is compared to the data collected during the current data collection cycle to determine any changes to asset inventory to keep the data up to date. Tennessee DOT summarizes this inventory data at the county level for planning and budgeting; however, they are currently working toward having the ability to report maintenance work at the asset level in the future.
Federal Highway Administration (FHWA). Pending publication 2019. Handbook for Including Ancillary Assets in Transportation Asset Management Programs. FHWA-HIF-19-068. Federal Highway Administration, Washington D.C.
Read more in the chapter: 7.2.2 How to Collect Data
Integrated Approach to Data Collection
Utah DOTUtah DOT started capturing LiDAR data for multiple assets in 2011. Several different business units within the agency provided funding for the effort, which has included collection of inventory data for bridges, walls, signs, signals, barriers, power poles, striping, curb cuts, drainage, shoulders and ATMS devices – as well as pavement condition and roadway geometrics. UDOT has leveraged this integrated pool of asset data for several different applications, including one which creates a draft cost estimate for asset installation for project scoping, based on existing inventory.
Read more in the chapter: 7.2.3 Preparing for Data CollectionAsset Class Tiers
Utah DOTTo accomplish the objective of allocating transportation funding toward the most valuable assets and those with the highest risk to system operation, UDOT developed a tiered system of asset management. Asset Management tiers range from one to three with tier one being the most extensive management plan for the highest value assets.
Tier 1. Performance-based management
- Accurate and sophisticated data collection
- Targets and measures set and tracked
- Predictive modeling and risk analysis
- Dedicated funding
Tier 2. Condition-based management
- Accurate data collection
- Condition targets
- Risk assessment primarily based on asset failure
Tier 3. Reactive management
- Risk assessment primarily based on asset failure
- General condition analysis
- Repair or replace when damaged
Source: Utah DOT. 2018. Utah TAMP. https://www.tamptemplate.org/tamp/053_utahdot/
Read more in the chapter: 2.3.2 Defining and Prioritizing Improvement in TAM ApproachesStrategic Communications
Utah DOTWhen meeting with legislators, the UDOT CEO uses the agency’s Strategic Directions Dashboard on a tablet device to communicate TAM-related information. He is able to quickly respond to questions and show information in a way that is easy to understand. The dashboard shows how UDOT is investing funds allocated by the Utah State Legislature. UDOT has taken advantage of the latest in online technology to provide a live, data- and performance-driven report that is constantly updated to reflect how they are reaching their strategic goals.
Source: https://dashboard.udot.utah.gov/strategic-direction
Read more in the chapter: 3.2.3 CommunicationCentralized TAM Unit
Utah DOTThe TAM unit at UDOT is located in the technology and innovation branch of the agency. This unit is responsible for meeting all TAM-related state and federal requirements and more importantly for advancing TAM and performance management (PM) at the agency. Utah has a strong centralized governance approach to its management so a centralized TAM unit with emphasis on information and innovation works well for advancing TAM.
Read more in the chapter: 3.1.1 Organizational ModelsSkill Building Through Training
Utah DOTThe Utah DOT has a strategic initiative to build a learning organization. A key element of this is a learning portal that includes training components. The training components include role expectations, guidance on how to fulfill key responsibilities of the role, and certification information. They have implemented modules for first time supervisors, transportation technicians, stormwater management and advanced leadership with more being developed monthly.
Read more in the chapter: 3.1.2 TAM Roles
Asset Sustainability Ratio
VTransThe Vermont Agency of Transportation (VTrans) includes asset value-related performance measures in its TAMP to help communicate financial stewardship. VTrans calculates an asset sustainability ratio (ASR) (estimated annual investment divided by the annual investment required to offset asset depreciation) for NHS pavements and bridges. An ASR over 100% implies that investments are sufficient to offset depreciation. Not only does VTrans calculate ASR for these assets, but it also predicts future changes to ASR under different revenue growth assumptions over a twenty year period. This prediction shows that without revenue growth, ASR will decline over time and VTrans’ investments will increasingly be outpaced by depreciation, resulting in deteriorating asset conditions. Depending on the circumstance, these measures can be used to make the case for additional funding to support asset management activities or to show an agency is efficiently deploying its resources.
Additional Resource
Vermont Agency of Transportation https://vtrans.vermont.gov/sites/aot/files/planning/documents/2022%20TAMP%20Update%20-%20FINAL.pdf
Data Sharing
VTransVTrans shares their data with the public through the VTransparency Public Information Portal. The goal of the portal is to “turn data into useful information for our customers” and to “create tools for getting answers to some of the questions we get most often”. The VTransparency Portal features different tools for viewing specific data. These tools include:
- Projects Map
- Road Conditions
- Plow Finder
- Weather Cams
- Maintenance Districts
- Crash Fatality Report
- Crash Query Tool
- Find a Project
- Daily Traffic
- Highway Closures
- Bridge Inspections
- Pavement Conditions
- Pavement Performance
- Maintenance Work
- Rail Asset Inventory
- Rail Bridge Inspections
- Rail Clearance
- Rail X-ing Inspections
The VTransparency Portal also links to the Vermont Open GeoData Portal. This provides GIS map layers related to the various tools for people interested in doing their own analysis of VTrans data. VTrans holds to the principle of making data available by default unless it is sensitive. The agency values transparency with the public and welcomes feedback on the tools they’ve developed. The VTransparency Portal can be accessed at https://vtrans.vermont.gov/vtransparency
Read more in the chapter: 7.3.2 Data SharingImportance of Communication for TAM Programs
VTransFormal and informal communication can travel both upwards and downwards within an organization. Those responsible for TAM at VTrans proactively manage communication where it is practical to do so. When seeking to inform or influence senior leadership, VTrans’ TAM program conveys not only the opportunities and impacts of funding decisions to decision-makers, but also provides context to foster informed choices. The TAM program builds support for the implementation, and elected officials and top management benefit from better context when TAM communication focuses on:
- Understanding current and future performance and how it affects state strategic priorities – How does asset performance influence agency objectives? For example, reducing the amount of bridges with an NBI rating of 1-3 needs to be related back to how freight movement, and economic indicators, can be improved.
- The impact of decisions – What will be achieved with additional/reduced funding or reduced restrictions on expenditure? With the use of life-cycle analysis and reporting of investment strategies, the TAM program can communicate the financial impact of different decision-making.
- The benefit of TAM – Report progress and how program successes are made relevant and advance agency objectives. These benefits are best articulated in terms that are understood by all throughout the organization, e.g. journey time savings/ reliability, and dollars saved. Communication about benefits also can confirm the benefit/implementation of previous decisions, and increase awareness of the success of “we did what we said we would”.
- Continual Improvement – What VTrans’ next TAM improvement will be and the benefit this will provide. Communication like this shows that the TAM program is heading in the right direction rather than continually being told to investigate/consider changes that may distract from strategic pursuits.
VTrans focuses on communication that reinforces confidence in TAM decision-making, to bolster stakeholder belief that the additional dollar invested will be spent in the right place at the right time. The agency also hired a communications consultant to help them develop engaging graphics to communicate critical and complex asset management principles into common, “every-day” storylines and language, transforming their AM approach and their TAMP into a product message that is easy to understand and digest.
Read more in the chapter: 3.2.3 Communication
VDOT Pavement Management Systems Assessment
Virginia DOTVirginia DOT (VDOT) has a long standing and high functioning Pavement Management program. This program is organized around a well-established pavement management system (PMS) and pavement maintenance scheduling system (PMSS). These systems are used by Central Office and District staff to forecast pavement conditions, allocate resources, and plan targeted preventative, corrective, and restorative maintenance projects. Although VDOT staff were confident in their program, they were motivated to identify if further improvement would be possible through data and/or system improvements.
*Note: This practice example was derived from NCHRP Final Research Implementation Report 08-115: Guidebook for Data and Information Systems for Transportation Asset Management. More TAM Data Assessment research implementation examples are available at: https://www.tamdataguide.com/research-implementation-examples/
Read more in the chapter: 7.1.5 TAM Data GuideVDOT Highway Maintenance Management System Assessment
Virginia DOTThis TAM Data Assessment examined the Virginia DOT maintenance management system to identify how current functionality could be expanded to support broader asset management of roadside assets.
*Note: This practice example was derived from NCHRP Final Research Implementation Report 08-115: Guidebook for Data and Information Systems for Transportation Asset Management. More TAM Data Assessment research implementation examples are available at: https://www.tamdataguide.com/research-implementation-examples/
Read more in the chapter: 7.1.5 TAM Data GuideDefining Roles & Responsibilities To Ensure Data Stays Current
Virginia DOTThe Virginia DOT maintains most of the assets on state roads and regularly assesses the condition of those assets for determining investment needs. For pavements and bridges, there are asset leads at both the central office and in the districts to monitor conditions and update the database based on work completed. Asset leads at the central office manage statewide data monitoring and analysis and provide guidance on the work that is needed. The asset leads in the districts are responsible for implementing the work and recording completed work in the bridge and pavement management systems so the information is always current.
Read more in the chapter: 6.2.2 Maintaining Asset DataPerformance Dashboard
Virginia DOTPerformance dashboards are also a popular way to present progress, using color-coded indicators similar to those on the dash of an automobile. An example of the interactive dashboard available from the Virginia DOT is shown in the figure. The screen reports performance in seven areas (performance, safety, condition, finance, management, projects, and citizen survey results) and the needles indicate whether the performance is within targeted ranges. Hyperlinks are available in each area if a user wants to explore historical trends or explore performance objectives in more detail.
Virginia DOT's Performance Dashboard
Source: Virginia DOT. 2019. http://dashboard.virginiadot.org/
Read more in the chapter: 6.1.1 Selecting and Using Performance MeasuresTAM Maintenance and Operations
Virginia DOTThe Virginia DOT maintains most of the assets on state roads. For pavements and bridges, there are asset leads at both the central office and in the districts. Asset leads at the central office manage data collection and analysis and provide guidance on the work that is needed. The asset leads in the districts are responsible for implementing the work and recording completed work in the bridge and pavement management systems. The guidance on what work will be done varies by asset class. For overhead sign structures, both the district structure and traffic lead are involved with guidance from the central office traffic engineering division.
Read more in the chapter: 3.1.2 TAM Roles
Gray Notebook: Quarterly Performance Report
Washington State DOTWashington State DOT (WSDOT) uses asset value-related performance measures for pavement assets to support responsible management of those assets as they deteriorate or depreciate. The WSDOT Gray Notebook, a quarterly performance report of the agency’s assets, includes several long-term measures for pavement assets, including Asset Sustainability Ratio (ASR), Remaining Service Life (RSL), and Deferred Preservation Liability (backlog).
ASR measures the agency’s investments in pavement against the lost value due to depreciation. RSL is a measure of remaining useful life before rehabilitation or replacement is needed due to deterioration. Backlog is the cost incurred due to delayed rehabilitation work. The agency sets targets and monitors trends for these measures, using them to communicate fiscal responsibility and allowing for improved asset management decision-making. In the 2021 Gray Notebook, for example, the RSL target is met, but the ASR fell short of the target, indicating that pavement investment was outpaced by deterioration in that year.
Source: Gray Notebook: Pavement Conditions & Performance. 2021. Washington State DOT. https://wsdot.wa.gov/about/data/gray-notebook/gnbhome/preservation/pavement/conditionperformance.htm
Read more in the chapter: 5.5.1 Asset Valuation FrameworkUse of a RACI Matrix for a Cross-Discipline Process
Seattle DOTThe City of Seattle has a Sidewalk Safety Repair Program to oversee the maintenance of the City’s many sidewalks and curbs to keep them safe and accessible. The Program includes a process for monitoring sidewalk conditions, investigating complaints of unsafe or inaccessible sidewalks, determining repair responsibility (e.g.., adjacent property owner, City, or other utility), using existing conditions to proactively mitigate conditions (beveling and asphalt shimming), and permanently repairing sidewalks that are the City’s responsibility. Repairs are leveraged with other capital projects as much as possible, so coordination with other Divisions is vital to the effectiveness of the program.
Because of the number of Divisions involved in managing sidewalks, the City assigned roles and responsibilities in a RACI matrix, that identifies those with Responsibility (R) or Accountability (A), those that need to be Consulted (C), and those that need to be Informed (I). The RACI matrix developed by the City includes one additional role beyond the four that are commonly included in the matrix. The City of Seattle added an “S” to represent a support role for personnel who might provide information to the process but are not necessarily responsible for completing the activity. The RACI matrix has served the City well by clarifying the responsibilities of each of the Divisions involved in some aspect of the Program so the program looks seamless to the public, as shown on the City’s website (https://www.seattle.gov/transportation/projects-and-programs/programs/maintenance-and-paving/sidewalk-repair-program).
Excerpt From a RACI Matrix Developed by the City of Seattle for Managing Roles and Responsibilities for its Sidewalk Repair Program
Source: City of Seattle. 2019.
Read more in the chapter: 6.5.3 Managing Implementation Responsibilities and ProcessesManaging the Risk of Unstable Slope Failure
Washington State DOTThe Washington State DOT recognized the potential safety risk to highway travelers and the adverse impact on regional commerce associated with unstable slope failure. To become more proactive in managing this risk, WSDOT developed the Unstable Slope Management System (USMS) that provides a method for evaluating known unstable slopes and using the information to prioritize slopes for funding of proactive stabilization efforts. The mitigation objective of the unstable slope management program is to sustain a desired state of good repair and low risk over the life span (> 20 years) of known unstable slopes and constructed geotechnical assets at the lowest practicable cost.
Read more in the chapter: 6.5.1 Monitoring and Managing RisksUse of Life Cycle Analysis to Improve Programming
Washington State DOTThe Washington State DOT conducted a pavement life cycle analysis using performance and cost data that demonstrated the cost-effectiveness of its pavement preservation projects. Based on the results that are documented in their Transportation Asset Management Plan (https://www.wsdot.wa.gov/sites/default/files/filefield_paths/WSDOT_TAMP_2019_Web.pdf), the DOT instituted a “one touch policy” requiring all capital projects to have had at least one pavement maintenance treatment by Maintenance or contracted work forces before it can be programmed for a pavement preservation project. This has enabled the DOT to defer capital improvements on pavements by two to three years, or in instances of multiple touches, by four to six years at a very low cost. In 2018, the agency received an additional $6 million to test a similar program on bridges. In addition to being a cost-effective use of available funds, the programs have helped build buy-in among maintenance personnel by demonstrating the importance of the data they collect.
Read more in the chapter: 6.4.3 Using Work History Information to Improve ModelsPerformance Reports
Washington DOTTo support accountability, credibility, and transparency, the Washington State DOT publishes its quarterly performance report, referred to as The Gray Notebook. Each edition of the Gray Notebook presents updates on multimodal systems' and programs' key functions and analysis of performance in strategic goal areas based on information reported to the Performance Management and Strategic Management offices of the Transportation Safety and Systems Analysis Division. Washington State DOT also publishes its Gray Notebook Lite, which highlights key metrics referenced in the Gray Notebook in a format for quick reading. Examples from each of these documents are presented in the figures.
The Gray Notebook and the Gray Notebook Lite
Source: WSDOT. 2019. https://wsdot.wa.gov/about/accountability/gray-notebook
Read more in the chapter: 6.1.1 Selecting and Using Performance MeasuresMaintenance Accountability Process
Washington DOTThe Washington DOT uses its Maintenance Accountability Process (MAP) to comprehensively manage maintenance budgets and to communicate the impacts of policy and budget to both internal and external stakeholders. Field condition surveys are conducted annually to assess the condition of 14 assets on the highway system such as signs and signals, ITS assets, tunnels, and highway lighting. For each asset, a level of service target is established, based on expected funding levels and importance of the asset to the agency’s strategic objectives. The targeted and actual performance is summarized on a statewide basis and presented to the legislature, media, internal stakeholders, and other DOTs in a format similar to what is shown in the figure (https://www.wsdot.wa.gov/NR/rdonlyres/8EC689DF-9894-43A8-AA0F-92F49AC374F5/0/MAPservicelevelreport.pdf). In 2018, Washington State DOT achieved 77 percent of its highway maintenance targets. Targets that were not achieved are shown as red bullseyes and areas where the targets were exceeded include a checkmark with the bullseye. The results illustrate where additional investment is needed on a statewide basis and provides a basis for setting maintenance priorities during the year.
Targeted and Actual Performance Results Used to Set Maintenance Priorities
Source: WSDOT. 2017. Multimodal Asset Performance Report. Washington State DOT. https://wsdot.wa.gov/publications/fulltext/graynotebook/Multimodal/AssetPerformanceReport_2017.pdf
Read more in the chapter: 6.1.1 Selecting and Using Performance MeasuresResource Allocation Policy
Washington State DOTWashington State DOT has worked closely with its legislature to adopt asset management based resource allocation policies.
The following is an excerpt from state legislation that was last updated in 2002:
”deficiencies on the state highway system shall be based on a policy of priority programming having as it’s basis the rational selection of projects and services according to factual need and an evaluation of life cycle costs...”
– RCW 47.05.010
This legislation along with good business practices has made Washington State DOT have one of the most mature asset management practices and an integrated set of tools, business processes, and organizational culture to support good asset management.
Source: http://apps.leg.wa.gov/RCW/default.aspx?cite=47.05
Read more in the chapter: 5.1.2 Transportation Agency ContextMaintenance Levels of Service
Washington State DOTWhen seeking to establish the connection between investments and performance across a wide range of assets or roadway attributes such as litter, vegetation height, drainage, or functionality it is helpful to relate all of the various measures of performance to a common rating scale. Washington State DOT has developed its Maintenance Accountability Process to establish the relationship between maintenance level of effort and the resulting level of service. The process rates conditions and services in seven areas using a common letter-grade system, or MLOS.
- Roadway Maintenance & Operations.
- Drainage Maintenance & Slope Repair.
- Roadside and Vegetation Management.
- Bridge & Urban Tunnel Maintenance and Operations.
- Snow & Ice Control Operations.
- Traffic Control Maintenance & Operations.
- Rest Area Operations.
Each group of services or conditions includes several performance measures, which are translated to the MLOS grades of “A” (highest performance), “B”, “C” (adequate performance), “D” or “F” (unacceptable performance). Applying the MLOS grades allows for a consistent means of rating performance across services and geographic regions. Letter grades can also be represented in photographs of facilities that meet the criteria for each condition state to support communications with stakeholder groups. The MLOS are outcome-based measures that allow the agency to predict the expected level of service that can be achieved based on anticipated budget and work planning decisions. By tracking maintenance expenditures and MLOS results annually, Washington State DOT is able to adjust its maintenance priorities and budgets to address system needs and stakeholder wants.
Source: https://www.wsdot.wa.gov/Maintenance/Accountability/
Read more in the chapter: 4.1.2 Defining Asset Service and Performance Levels
TAM Project Prioritization
Wyoming DOTWYDOT is increasing the use of performance-based project selection in order to optimize funding expenditures and meet their performance targets. This process helps guide resource allocation decisions in a constrained funding environment. WYDOT adopted a robust computerized system that moved the agency from project selection predominantly based on emphasizing current condition to project selection based on optimizing future estimated condition. Program managers for each asset type are responsible for maintaining their individual management systems in order to make performance forecasts within their program areas. The TAM lead works with the program managers to get the guidance to the districts. The TAM lead has been working with districts to build confidence in the management system outputs and the decision-process. This improvement has yielded WYDOT’s ability to deliver the targets that they project.
Read more in the chapter: 3.1.2 TAM RolesThe guide has features designed to support practitioners who are…
New to TAM
The guide features information curated specifically for those new to TAM – whether new to a transportation agency, recently transferred to the asset management division, or students beginning research in TAM.
Building Knowledge
Asset management practitioners may be interested in learning more about a specific TAM topic. For example, a practitioner might be interested resource allocation as their agency begins to discuss different ways to allocate funding among assets.
Strengthening Practices
An asset management practitioner may also be interested in strengthening a specific aspect of their TAM program. For example, a practitioner may want to strengthen their agency’s data governance and management practices related to TAM.
The guide features Practice Examples from organizations around the country, Checklists to help guide TAM improvements, and How-To Guides for accomplishing common and critical TAM tasks. Choose a tab below to browse Practice Examples, Checklists, and How-To Guides from the TAM Guide!
Asset Class Tiers
Utah DOT
To accomplish the objective of allocating transportation funding toward the most valuable assets and those with the highest risk to system operation, UDOT developed a tiered system of asset management. Asset Management tiers range from one to three with tier one being the most extensive management plan for the highest value assets.
Tier 1. Performance-based management
- Accurate and sophisticated data collection
- Targets and measures set and tracked
- Predictive modeling and risk analysis
- Dedicated funding
Tier 2. Condition-based management
- Accurate data collection
- Condition targets
- Risk assessment primarily based on asset failure
Tier 3. Reactive management
- Risk assessment primarily based on asset failure
- General condition analysis
- Repair or replace when damaged
Source: Utah DOT. 2018. Utah TAMP. https://www.tamptemplate.org/tamp/053_utahdot/
Read more in the chapter: 2.3.2 Defining and Prioritizing Improvement in TAM Approaches
Utah DOT
To accomplish the objective of allocating transportation funding toward the most valuable assets and those with the highest risk to syste…
Selecting Assets to Include
Aurizon
Aurizon is Australia’s largest freight rail operator, transporting more than 500 million tons of coal to markets including Japan, China, South Korea, India, and Taiwan, in addition to over 800 million tons of freight through an extensive network throughout the country. Aurizon Network manages the largest heavy haul rail infrastructure network in the country. The network is economically regulated by the State through a process that sets investment levels and tariffs. Asset management practice is well-entrenched in the organization, with a focus on “optimizing the life of assets, keeping a tension between investment in maintenance and capital.” The scope of the Aurizon Network asset base, known as the Regulated Asset Base includes all assets used in the provision of the rail infrastructure service. Management is informed by external engineering standards and legislative and regulatory obligations including:
- Prevention and intervention levels specified in an Asset Maintenance and Renewals Policy.
- Commitments to the Central Queensland Coal Network.
- A Safety Management System aimed to minimize safety risks.
- Network Strategic Asset Plan models which are based on asset age, predicted condition and historical and forecasted usage.
Source: Aurizon. 2019. Network: Planning and Development.https://www.aurizon.com.au/what-we-deliver/network#planning---development
Read more in the chapter: 2.3.2 Defining and Prioritizing Improvement in TAM Approaches
Aurizon
Aurizon is Australia’s largest freight rail operator, transporting more than 500 million tons of coal to markets including Japan, China…
TAM Strategy: Implementing Actions to Close the Gap
Clackamas County DOT
Based on their gap assessment, Clackamas County Department of Transportation and Development established a Transportation Asset Management Strategic Plan (TAMSP), which documents its methods to implementing a comprehensive transportation asset management program over a five year period. This TAMSP was accompanied by an asset management implementation strategy that identified the key actions to be undertaken.
Clackamas County, 2051 Kaen Road #426 Oregon City, OR 97045
Extract from Clackamas County DOT Implementation Plan
Read more in the chapter: 2.3.3 Developing a TAM Implementation Plan
Clackamas County DOT
TAM Strategy: Implementing Actions to Close the Gap
Based on their gap assessment, Clackamas County Department of Transportation and Development established a Transportation Asset Managemen…
Monitoring TAM Program Improvements
New Zealand Transport Agency
The New Zealand Treasury stewards the NZ government’s Investment Management System to optimize value from new and existing investments and assets for current and future generations of New Zealanders. One of the tools the system uses is the Investor Confidence Rating (ICR), which illustrates the confidence that government leadership (i.e. Ministers) can have in an agency’s ability to deliver investments that produce the desired results.
The ICR also promotes and provides a pathway for capability uplift. One element of the ICR evaluates the gap between current and target asset management maturity levels on the basis that good asset management practice provides the foundation for good investment management. The Treasury recommends periodic self-assessments using a methodology based on international asset management guidelines and the ISO 55001 standard.
The ICR assessment is conducted every 3 years, resulting in more decision-making autonomy for agencies that obtain a good rating and potential flexibility over investment assurance arrangement.
Adapted from New Zealand Treasury. Investor Confidence Rating (ICR).
https://treasury.govt.nz/information-and-services/state-sector-leadership/investment-management/review-investment-reviews/investor-confidence-rating-icr
Read more in the chapter: 2.3.4 Monitoring TAM Program Improvements
New Zealand Transport Agency
Monitoring TAM Program Improvements
The New Zealand Treasury stewards the NZ government’s Investment Management System to optimize value from new and existing investments …
TAMP Requirements Checklist
Colorado DOT
To ensure alignment with the requirements of MAP-21, Colorado DOT developed a requirements checklist that provides a quick reference/summary of the legislation requirements. The checklist is based on FHWA guidance (Transportation Asset Management Plan Annual Consistency Determination Final Guidance) that was issued in February, 2018. Its content was provided to help DOTs ensure their TAMPs are compliant and consistent with statute and regulatory requirements.
Source: FHWA. Transportation Asset Management Plan Annual Consistency Determination Final Guidance. https://www.fhwa.dot.gov/asset/guidance/consistency.pdf
Read more in the chapter: 2.4.1 The Basic TAMP
Colorado DOT
To ensure alignment with the requirements of MAP-21, Colorado DOT developed a requirements checklist that provides a quick reference/summ…
TAMP Builder
AASHTO
The AASHTO TAMP Builder website (available at https://www.tamptemplate.org/) hosts annotated plan outlines to assist agencies in preparing TAMPs. The site also provides resources to customize an outline in order to meet agency-specific objectives and requirements. The website integrates a database of TAMPs, dating from 2005, that support the functionality of the outlines created using the site.
Use this Site to Build a MAP-21-Comlpiant TAMP
Read more in the chapter:
AASHTO
The AASHTO TAMP Builder website (available at https://www.tamptemplate.org/) hosts annotated …
Vegetation Control
Yukon Department of Highways and Public Works
The Yukon Department of Transportation and Public Works (TPW) is committed to taking a consistent, strategic approach to asset planning and management; to deliver services matching their customers’ expectations, while maximizing value for money. Vegetation management is a key part of TPW’s roadside safety program. It improves highway safety and helps preserve their infrastructure by:
- Improving visibility and vehicle sight lines.
- Reducing wildlife collisions.
- Establishing a clear zone.
- Facilitating roadside drainage.
- Preserving roadside surfaces.
- Controlling invasive weeds.
- Enhancing the overall driving experience.
The TPW roadside vegetation management program was established in the early 2000’s to address the challenges of maintaining right-of-way growth throughout Yukon. Over the past few years, the program was reassessed, leading to several improvements in the inspections and decision-making processes. This included establishing a life cycle model in the agency's dTIMS management system, to project the future condition of roadside vegetation, generate possible treatment strategies (e.g., mowing, brushing) for each section of road, and identify an optimal solution by assessing the life cycle costs and benefits from each treatment strategy for each road section. This included steps to define and compile the model inputs, including roadway inventory, vegetation condition ratings, deterioration curves, treatment options, treatment decision logic and financial parameters. The dTIMS roadside vegetation life cycle model was used to develop an optimized long-term investment plan that assessed the impacts of alternative budget scenarios and/or constraints. It also provided an example of how the software could be used by TPW staff to later model decision making for other asset types.
Read more in the chapter: 2.5.5 Managing Ancillary Asset Data
Yukon Department of Highways and Public Works
The Yukon Department of Transportation and Public Works (TPW) is committed to taking a consistent, strategic approach to asset planning a…
Integrating Equity in Transportation Decision-Making
MnDOT
Minnesota Department of Transportation (MnDOT) has integrated equity into transportation decision-making through its Advancing Transportation Equity Initiative, which seeks to enhance access and opportunities for underserved communities in the state. This initiative is based on community input and feedback received during the development of the 2017 Statewide Multimodal Transportation Plan. The plan identified the reduction of transportation disparities and the incorporation of equity into decision-making processes as high-priority objectives. The 2022 Statewide Multimodal Transportation Plan, along with its internal Strategic Plan, includes additional goals, strategies, and actions to further advance transportation equity. MnDOT is committed to creating an equitable transportation system.
| Acknowledge Inequalities | Defining Transportation Equity: | Proposed Journey |
|---|---|---|
| MnDOT acknowledges historical injustices in transportation, where some communities were underserved and harmed by agency decisions. They recognize that past choices denied Black, Indigenous, and disabled communities full transportation benefits. | Transportation equity, as defined by MnDOT, seeks fairness and justice in the distribution of benefits and burdens within transportation systems, with a focus on empowering underserved communities, particularly Black, Indigenous, and People of Color, in decision-making processes. | MnDOT acknowledges that their journey toward transforming transportation systems and achieving equity requires ongoing listening, learning, adaptation, and implementation. |
MnDOT has facilitated a series of conversations between MnDOT staff and individuals and organizations that work with and represent underserved communities in Minnesota through the Community Conversation Project. The objective of these conversations is to directly learn from underserved communities about their unique experiences and challenges with transportation. Main findings include:
- Inadequate transportation options create barriers to the community.
- Private vehicles are common.
- Capacity of public transit does not meet demand.
- Land use and natural barriers also affect access.
- Relationships are key to engagement.
- People have many ideas to solve challenges with transportation equity.
- Organizations provided varied definitions and examples of equity.
These conversations have culminated in the creation of a report for each of the eight operational districts, which summarizes findings and provides recommendations for the future direction of transportation decisions. Additionally, MnDOT has initiated "The Equitable Contracting and Engagement" project to explore methods of enhancing the accessibility and inclusivity of MnDOT's contracting and engagement processes. MnDOT aims to collaborate with more community-based organizations and nonprofits and advance their engagement efforts. Furthermore, MnDOT has prioritized and sponsored research projects with an equity focus to enhance understanding and promote initiatives that embrace equity principles.
Note: This practice example was derived from the Minnesota Department of Transportation’s website. Further details on the “Advancing Transportation Equity Initiative” can be found here: https://dot.state.mn.us/planning/program/advancing-transportation-equity/
Read more in the chapter: 2.6.2 Integrating Equity in TAM Practices
MnDOT
Integrating Equity in Transportation Decision-Making
Minnesota Department of Transportation (MnDOT) has integrated equity into transportation decision-making through its Advancing Transporta…
Building a TAM Unit in the Executive Office
Caltrans
In 2015, the Caltrans Director created a TAM lead in the agency, recognizing the importance of TAM and the necessity of having a TAM lead who is responsible for implementing TAM and meeting federal and state TAM-related requirements. The TAM lead reports directly to the Caltrans Chief Deputy Director. The TAM lead started without any staff, but the unit has grown to house over ten people. The TAM lead is a veteran of the department and is able to advance the TAM program by getting leadership commitment at the executive level and having the business units throughout the department contribute to needed activities.
Read more in the chapter: 3.1.1 Organizational Models
Caltrans
Building a TAM Unit in the Executive Office
In 2015, the Caltrans Director created a TAM lead in the agency, recognizing the importance of TAM and the necessity of having a TAM lead…
Asset Management Organizational Models - Executive Office
Caltrans
At Caltrans, the TAM group is in the executive office because of a desire to elevate the importance of asset management. The TAM group has more than 10 people in it who manage the TAMP development, and are also responsible for resource allocation for the State Highway Operation and Protection Program (SHOPP). The SHOPP is a ~$4B annual program for major projects on the California State Highway System (SHS).
Read more in the chapter: 3.1.1 Organizational Models
Caltrans
Asset Management Organizational Models - Executive Office
At Caltrans, the TAM group is in the executive office because of a desire to elevate the importance of asset management. The TAM group ha…
Asset Management Organizational Models - Planning Office
Michigan DOT
At Michigan DOT, the asset management function is distributed across the agency, but the TAM lead is in the planning bureau. Locating the TAM lead within planning provides a strong link to strategic investment planning and decision-making.
Read more in the chapter: 3.1.1 Organizational Models
Michigan DOT
Asset Management Organizational Models - Planning Office
At Michigan DOT, the asset management function is distributed across the agency, but the TAM lead is in the planning bureau. Locating the…
Asset Management Organizational Models - Engineering Office
Connecticut DOT
The Connecticut DOT TAM unit resides in the Bureau of Engineering and Construction and reports directly to the Office of the Chief Engineer. The TAM Unit works with asset stewards, designated for each asset, to coordinate TAM activities across the Department.
Read more in the chapter: 3.1.1 Organizational Models
Connecticut DOT
Asset Management Organizational Models - Engineering Office
The Connecticut DOT TAM unit resides in the Bureau of Engineering and Construction and reports directly to the Office of the Chief Engine…
Checklist
Checklist
Checklist
Checklist
Checklist
Checklist
Checklist
Checklist
How To
How To

